


The German index continues to see upward momentum on Friday, as we continue to watch oil prices and the idea of oil costs in the European Union.
The oil market dropping early on Friday has helped.
The DAX has rallied quite nicely during the trading session on Friday, as it looks like we are simply bouncing around in a significant, well-defined range, with €25,250 on the bottom and the €25,750 level on the top. This is a range that has been fairly reliable at this point in time.
Top Regulated Brokers
Ultimately, I think this is a market that continues to be noisy and choppy. It is worth noting that a lot of this will come down to oil markets and yields in the Bund as well. A little bit of relief from lower oil prices and bond yields in Germany has helped a bit. That being said, it is still a sideways market.
DAX Holds Above the 200-Day EMA Heading Into the Weekend
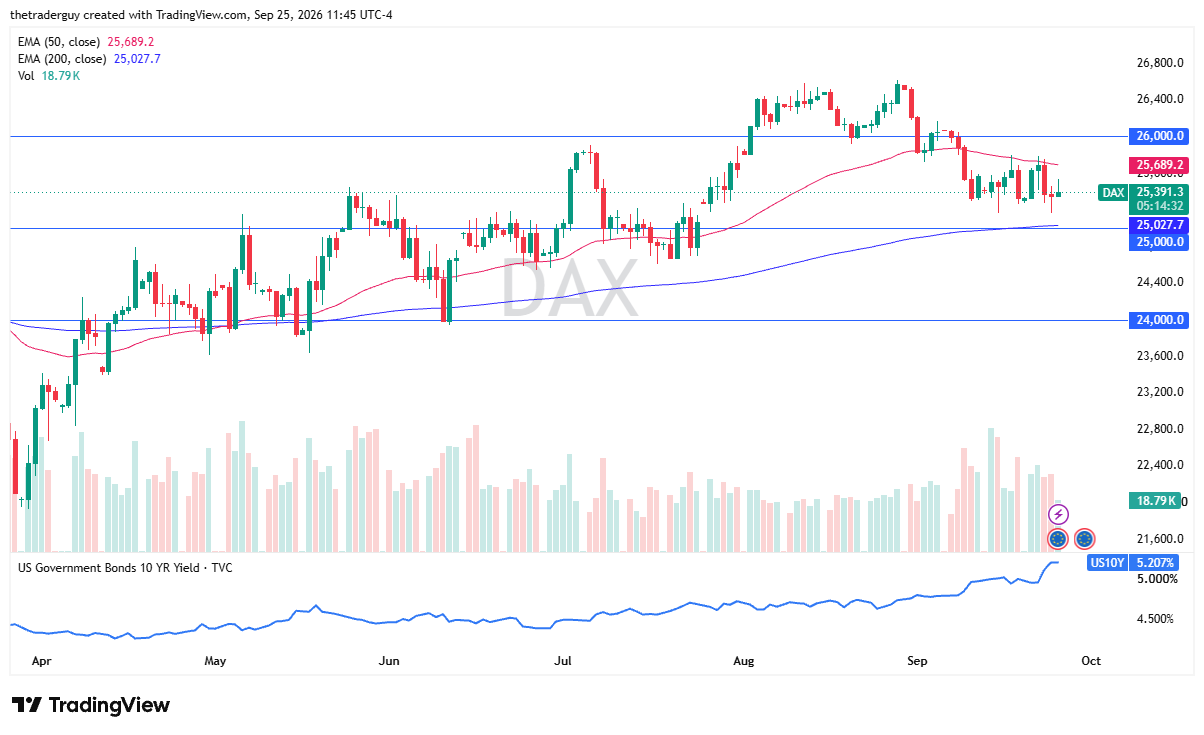
It's worth noting that we're heading into a weekend that could have almost any type of headline come out. I'm not looking for a massive move higher, but it would not surprise me at all to see this end up going sideways a little bit here, maybe trying to get to the top of the range and then reassessing.
With that being the case, caution is the better part of valor. In fact, I might trim my position heading into the weekend, but I would not short the index. I think the 200-day EMA sitting just above the €25,000 level is not a coincidence either. As a result, I find this neutral to positive, given enough time. It is not until we break down below the €25,000 level that I would become bearish.
Ready to trade our stock market forecast and analysis? Here are the best CFD stocks brokers to choose from