


Alphabet (NASDAQ: GOOG) delivered a second quarter that comfortably beat Wall Street expectations, but shares initially sold off after management raised 2026 capital expenditure guidance. While the latest earnings release has reframed the AI capex debate, are investors too fixated on a single number?
The stock has rebounded from its post-earnings sell-off. Do a cloud surge, a record backlog, and strategic AI developments make Alphabet’s infrastructure leadership the market’s most underappreciated story?
Top Regulated Brokers
Why a Cloud Surge and Record Backlog Could Reshape Alphabet’s Growth Story
While a backlog represents revenue that customers have committed to but Alphabet has not yet recognized, it also comes with surging cloud growth. Therefore, rather than unrealized commitment, investors get genuine enterprise demand, driven by Alphabet’s full-stack model. It offers frontier models, custom silicon, and hyperscale data centers, and expands on our previous note, “Alphabet’s “Frozen v2” Chip Report Lands Right Before Earnings: Is Wall Street Underestimating Google’s AI Hardware Edge?”
The full-stack model allows Alphabet to compound every layer of the AI value chain into pricing power and margin leverage. Bears frame aggressive AI capex as their reasoning, but does Alphabet’s pipeline lay the foundation for durable infrastructure leadership?
Key Alphabet Fundamental and Valuation Facts to Watch Today
Google Cloud’s backlog grew by more than $50 billion to $514 billion, and it expects to convert roughly 50% of that into bookable revenue within 24 months. Alphabet also expanded operating margins by 36%. TPU sales are entering the backlog, Gemini 3 is powering AI Solutions demand, and Google is backing a $15 billion AI campus in Texas, but is the market still pricing a leader as a laggard?
Metric | Value | Verdict |
P/E Ratio | 17.73 | Bullish |
P/B Ratio | 6.94 | Bearish |
PEG Ratio | 0.96 | Bullish |
Current Ratio | 2.72 | Bullish |
Return on Assets | 12.96% | Bullish |
Return on Equity | 48.68% | Bullish |
Profit Margin | 54.77% | Bullish |
ROIC-WACC Ratio | Positive | Bullish |
Dividend Yield | 0.25% | Bearish |
Alphabet Fundamental Analysis Snapshot
Price action retreated into a horizontal support zone, from where bullish trading volumes began to increase. Still, the Bull Bear Power Indicator is bearish, with an ascending trendline pushing it toward a potential bullish crossover.
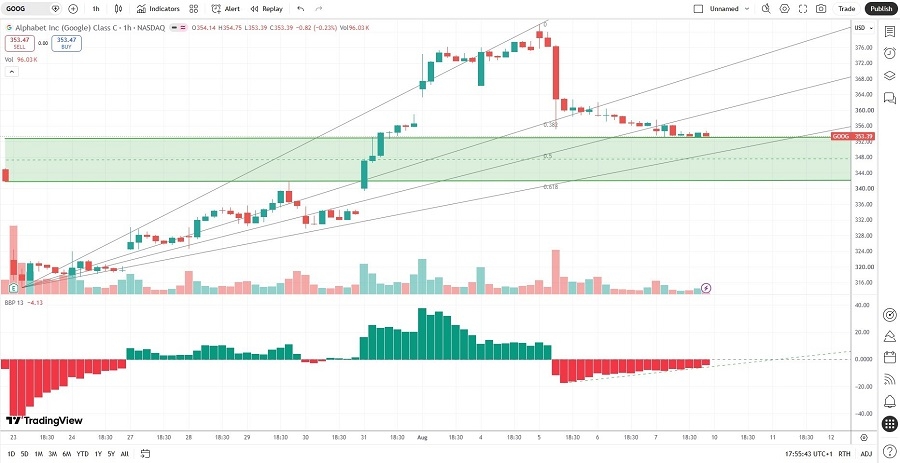
Alphabet Price Chart
Where Bears Push Back and Why It May Not Hold
Bears continue to argue that $205 billion in AI capex pressures free cash flow, while TPU hardware sales boost the backlog but are less predictable than recurring software revenue. Some investors remain uneasy about Alphabet's AI leadership overhaul, despite an excellent quarter. While bears raise valid concerns, are they right to worry about free cash flow?
Bulls counter that cloud margins are expanding, driving most of Alphabet's growth, while vertical integration reduces reliance on third-party GPU suppliers. Fundamentals and sentiment align, and Alphabet remains the most undervalued hyperscaler. Since enterprise demand outstrips supply, how much longer can bears keep a valuation discount on Alphabet?
What Today’s Setup Highlights About Market Sentiment
The average price target of $421.79 indicates good upside potential, while downside risk remains but is decreasing. After shares recovered from their post-earnings low, is Wall Street underestimating how much visibility a half-trillion-dollar backlog provides versus peers still fighting for compute capacity?
Options activity shows Alphabet’s put/call open interest ratio near 0.82, confirming more open bullish call positions than bearish put positions. Alphabet ranks among the most-traded companies in the options market, and high call volume at higher strike prices suggests traders are positioning for more upside. Is Alphabet a buy-the-dip candidate?
What’s Next for Alphabet’s AI-Driven Story
Will investors reward backlog conversion and disciplined capex commentary in the quarters ahead? Today’s session could see a bounce off its horizontal support zone, but what happens if bears reclaim $346.45?
My GOOG Long Trade for the Current Setup
GOOG Entry Level: Between $348.38 and $356.50
GOOG Take Profit: Between $381.81 and $389.71
GOOG Stop Loss: Between $334.55 and $339.30
Risk/Reward Ratio: 2.42
Ready to trade our stock market forecast and analysis? Here are the best CFD stocks brokers to choose from.