


Top Regulated Brokers
What Are Meme Stocks?
A meme stock refers to a publicly listed company that is trending among retail traders on social media. Super Micro Computer and Telegram channels are among the favorite social media platforms for retail traders to engage in social trading, in-depth discussions, and short-term price speculation.
Trading in meme stocks is similar to a pump-and-dump scheme, which is illegal, but to date, regulators have tolerated the meme craze. Retail investors band together and agree to buy a beaten-down stock, often a well-known penny stock with high institutional short interest. It has created massive market volatility and, in some cases, sparked a short squeeze.
Why Should You Consider Buying Meme Stocks?
Meme stocks trade at depressed levels for a reason, and traders must understand why their share prices are where they are.
Here are some criteria to consider:
A well-known company that played a role in the life of traders, especially growing up (for example, Krispy Kreme, Avis, and GameStop)
A high interest by retail traders on social media
Follow popular social media channels, and try to catch the first wave of buy orders
Ensure you place a stop-loss order when you enter your buy order
Only use capital that you can afford to lose
What Are the Downsides of Meme Stocks?
Meme stocks are high-risk, short-term gambles, and many institutional traders heavily short them. Traders can lose their capital in a matter of seconds if they enter at the wrong time. Meme stocks experience excessive volatility, characterized by sharp rallies and even sharper sell-offs. They often suffer from depressed share prices and are mostly penny stocks trading below $5 per share.
Here is a shortlist of attractive meme stocks:
Rocket Companies (RKT)
Rocket Lab Corporation (RKLB)
Riot Platforms (RIOT)
Kohl's (KSS)
Viridian Therapeutics (VRDN)
An Update on Our Previous Best Meme Stocks to Buy Now
In our previous installment, I highlighted the upside potential of The Wendy’s Company and Super Micro Computer.
The Wendy’s Company (NASDAQ: WEN) - A long position in WEN between $7.50 and $7.80
WEN rallied over 25%, and my stop-loss was triggered at $9.00, resulting in a 20% profit.
Super Micro Computer (NASDAQ: SMCI) - A long position in SMCI between $26.50 and $29.14
SMCI is down over 9%, but I maintain my positions as originally outlined, as the upside catalysts remain in place.
Rocket Companies (NYSE: RKT) Fundamental Analysis
Rocket Companies (NYSE: RKT) is a fintech and homeownership services company and one of the largest mortgage lenders in the US. Its subsidiaries include Redfin, Forsalebyowner.com, and Rocket Money. Rocket Companies is a component of the DORK basket and also a Russell 1000 constituent.
So, why am I bullish on Rocket Companies following its breakout?
The $2.11 trillion mortgage servicing rights (MSR) portfolio is my core bullish catalyst, as higher mortgage rates will extend the portfolio’s lifespan at the cost of less fresh origination. The Redfin acquisition has tripled the number of digital mortgage purchase leads, lowering acquisition costs, while Rocket Companies is one year ahead of its plan to realize $400 million in cost synergies.
Metric | Value | Verdict |
P/E Ratio | 107.54 | Bearish |
P/B Ratio | 1.70 | Bullish |
PEG Ratio | 0.53 | Bullish |
Current Ratio | 2.48 | Bullish |
Return on Assets | 2.23% | Bearish |
Return on Equity | 1.73% | Bearish |
Profit Margin | 2.68% | Bearish |
ROIC-WACC Ratio | Negative | Bearish |
Dividend Yield | 0.00% | Bearish |
Rocket Companies Fundamental Analysis Snapshot
The trailing price-to-earnings (P/E) ratio of 107.54 makes RKT an expensive stock. By comparison, the P/E ratio for the S&P 500 Index is 28.14.
The average analyst price target for Rocket Companies is $19.02. It suggests excellent upside potential, with manageable downside risk.
Rocket Companies Technical Analysis
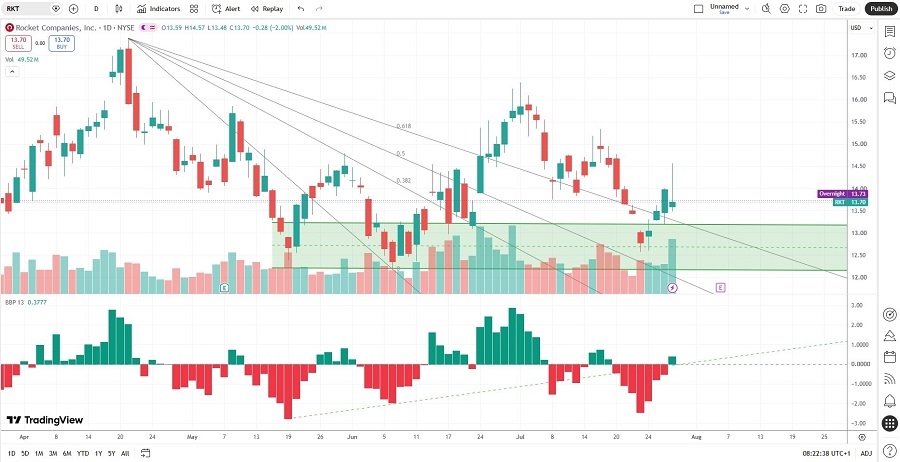
The Rocket Companies D1 chart shows price action breaking out above its ascending Fibonacci Retracement Fan.
It also shows Rocket Companies breaking out above a horizontal support zone.
The Bull Bear Power Indicator turned bullish with an ascending trendline.
My Rocket Companies Long Stock Trade
RKT Entry Level: Between $13.20 and $14.00
RKT Take Profit: Between $17.36 and $19.02
RKT Stop Loss: Between $11.36 and $11.88
Risk/Reward Ratio: 2.26
Rocket Lab Corporation (NASDAQ: RKLB) Fundamental Analysis
Rocket Lab Corporation (NASDAQ: RKLB) is the most notable small-lift launch vehicle operator globally, driven by its Electron orbital rocket. Its next-generation reusable Neutron medium-lift launch vehicle is in development to support constellation deployment, interplanetary missions, and human spaceflight. RKLB is also a NASDAQ 100 constituent.
So, why am I bullish on Rocket Lab Corporation following its 60%+ correction?
Rocket Lab’s first flight of Neutron, slated for the fourth quarter of 2026, is the most notable upside catalyst that makes the current correction a buy-the-dip candidate. A successful debut will unlock the $5.6 billion National Security Space Launch (NSSL) Phase 3 Lane 1 program, where Rocket Lab is already a certified provider. It also has a record $2.2 billion backlog, an $816 million contract to build missile defense satellites for the Space Development Agency, and a $266 million US Air Force contract for hypersonic test flights.
Metric | Value | Verdict |
P/E Ratio | Unavailable | Bearish |
P/B Ratio | 17.63 | Bearish |
PEG Ratio | Unavailable | Bearish |
Current Ratio | 4.47 | Bullish |
Return on Assets | -6.58% | Bearish |
Return on Equity | -13.55% | Bearish |
Profit Margin | -26.87% | Bearish |
ROIC-WACC Ratio | Negative | Bearish |
Dividend Yield | 0.00% | Bearish |
Rocket Lab Corporation Fundamental Analysis Snapshot
The price-to-earnings (P/E) ratio for RKLB is unavailable. By comparison, the P/E ratio for the NASDAQ 100 Index is 30.40.
The average analyst price target for Rocket Lab Corporation is $114.47. It suggests excellent upside potential, while downside risks are manageable.
Rocket Lab Corporation Technical Analysis
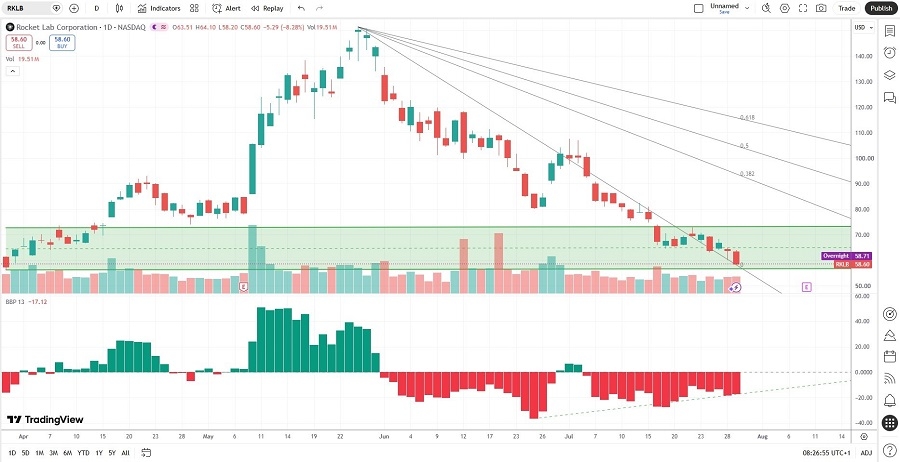
The Rocket Lab Corporation D1 chart shows price action between its descending 0.0% and 38.2% Fibonacci Retracement Fan levels.
It also shows Rocket Lab Corporation inside a horizontal support zone.
The Bull Bear Power Indicator is bearish with a positive divergence.
My Rocket Lab Corporation Long Stock Trade
RKLB Entry Level: Between $56.13 and $64.10
RKLB Take Profit: Between $99.61 and $107.60
RKLB Stop Loss: Between $37.57 and $42.39
Risk/Reward Ratio: 2.34
A Note of Caution
Please remember the high-risk nature of trading meme stocks. They are highly volatile, face balance sheet and operational issues, and can wipe out portfolios in a few seconds. Some meme stocks can swing 50% to 100% in short periods without corporate developments.
Ready to trade our meme stocks analysis? Here are the best CFD stocks brokers to choose from.