


Tesla (NASDAQ:TSLA) spent much of the past two years fighting a narrative of fading relevance in the world’s largest EV market. Did June’s sales data just flip that script and force a reassessment of its competitive position?
Top Regulated Brokers
The Model Y was the best-selling vehicle in China last month, combustion or electric, while Shanghai-built deliveries logged an eighth straight month of year-over-year growth, even as key rivals stalled. Is the market underestimating how much momentum is building beneath Tesla’s China operations and how durable this strength might be?
What Model Y’s China Leadership Really Reveals About Tesla’s Position
Tesla has posted a solid second-quarter delivery report, and the launch of Robotaxi in Miami, as outlined in last week’s note, “Tesla’s Robotaxi Leap - Is Miami the Catalyst That Ignites the Next Growth Chapter?” improved the bullish narrative. Now, Tesla’s Model Y sold roughly 38,600 units in China in June, topping the country’s sales charts ahead of Geely’s Galaxy Xingyuan and Leapmotor’s A10, per Yiche data.
It shows that Tesla is regaining share in an ultra-competitive market, even as its overall domestic retail volume still trails behind last year’s pace. Rising market share alongside a shrinking EV market suggests that Tesla is outpacing its rivals despite headwinds. Could sustained Model Y leadership be the catalyst long-term bulls have been waiting for?
Key Tesla Fundamentals and Technical Signals Traders Should Watch
Still, more interesting than the accumulating bullish catalysts is the inability of shares to mount a sustained rally, as skeptics note that price cuts and financing incentives have done much of the heavy lifting and that margin pressure from years of discounting remains a legitimate concern. Does the market fully credit Tesla for winning against domestic champions like BYD and Leapmotor on their home turf?
Metric | Value | Verdict |
P/E Ratio | 358.87 | Bearish |
P/B Ratio | 18.21 | Bearish |
PEG Ratio | 5.11 | Bearish |
Current Ratio | 2.04 | Bullish |
Return on Assets | 2.23% | Bearish |
Return on Equity | 4.90% | Bearish |
Profit Margin | 3.95% | Bearish |
ROIC-WACC Ratio | Negative | Bearish |
Dividend Yield | 0.00% | Bearish |
Tesla Fundamental Analysis Snapshot
Price action retreated into a horizontal support zone, from where it broke out three times, but each breakout had a lower high, a trend worth monitoring. The Bull Bear Power Indicator turned bearish, forming a descending trendline, but bearish trading volume is decreasing.
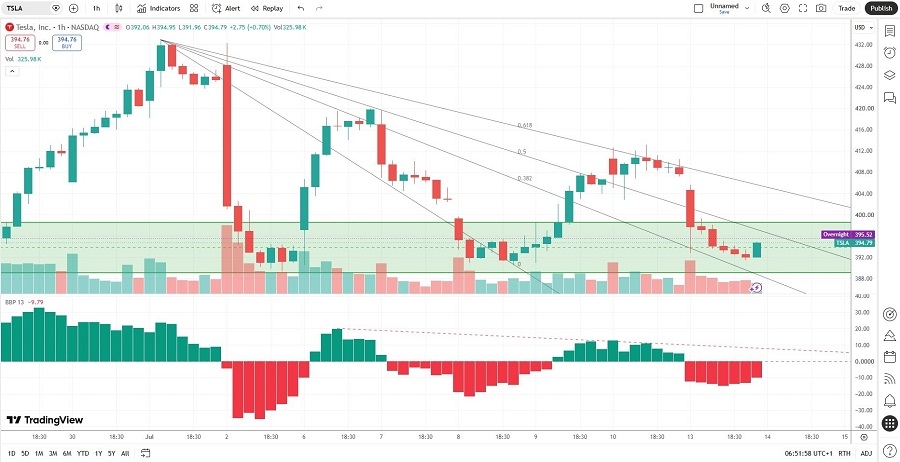
Tesla Price Chart
How Software Rollouts and Exports Add Underappreciated Upside for Tesla
Adding a smaller data point to the bulli case of Tesla’s resurging strength in Asia is the roll-out of FSD (Supervised) V14 Lite in South Korea, the first international market to receive the Hardware 3 update outside the US. Does the market discount the upside of Tesla’s software-defined vehicle advantage for older fleets abroad?
The disconnect between bullish developments and a weakening technical chart is worth considering, but bulls should also account for European export demand flowing through Tesla’s Shanghai supply chain. It adds a second tailwind, giving Tesla two channels of demand that support one factory’s output. Will dual demand hold into the rest of the year and shift China from a headwind to a genuine growth driver?
What Today’s Tesla Setup Says About Shifting Market Sentiment
The average analyst price target of $425.23 indicates moderate upside potential with decreasing downside risk. Does Wall Street’s caution reflect valuation concerns, or is it lagging the bullish developments now across Asia and in Tesla’s largest overseas market?
Despite multiple bullish developments, bears continue to make a comeback, but have markets mispriced the upside potential with Model Y leadership in China and international software rollouts expanding? The ingredients supporting renewed bullish sentiment are available, but will margins hold up?
Where Tesla’s Price Action Could Break If China Momentum Holds
Price action was unable to sustain the Miami Robotaxi momentum, and it is now trending lower between its descending 38.2% and 50.0% Fibonacci Retracement Fan levels. Can China’s Model Y momentum be the catalyst that closes the gap between operational improvement and the share price? A breakout above $413.15 could confirm it, but what if shares give up the $368.60 level?
Ready to trade our analysis of Tesla? Here is our list of the best stockbrokers worth reviewing.