
Microsoft’s AI Infrastructure Investments: Do They Suggest Unlocked Value?
Top Regulated Brokers
Microsoft (NASDAQ:MSFT) shows signs of a shift in sentiment, with the technical chart indicating numerous encouraging developments today. How will investors react to the latest AI-driven progress? How will they account for the discrepancy between trading volume and the value proposition?
Valuations have decreased, and some retail investors may see this as confirmation of a pending rebound driven by bullish sentiment, but how does it compare to the slowly changing AI trend from offering premium models to cost-per-token pricing structures?
How Microsoft’s AI Strategy Could Unlock Hidden Value
After the initial headline-grabbing announcements of capital expenditures by hyperscalers, Wall Street began to question this strategy, as revenue has risen substantially, as evidenced by Microsoft’s Azure unit, but failed to fully justify the massive investments. It has also raised inflation concerns, but Microsoft offers a multi-layered revenue stream spanning numerous undervalued categories, as outlined in last week’s item, “Do Defense Contracts Indicate Hidden Value?”
Microsoft remains ahead of the curve to quadruple its data center output by 2028, and it opened its Wisconsin AI data center ahead of schedule as part of its expansion program. It confirms that Microsoft develops to maintain its competitive edge, but have investors mispriced the unlocked value of its multi-faceted AI strategy today?
Key Microsoft Fundamentals and Technical Signals Traders Should Watch
Microsoft has signed a 20-year landmark deal with Chevron to develop a 2.7 GW natural gas facility in West Texas dedicated to AI workloads and long-term data center expansion. Have investors ignored it, as measured by ongoing value compression, or do they dismiss its significance entirely?
Metric | Value | Verdict |
P/E Ratio | 22.19 | Bullish |
P/B Ratio | 6.69 | Bearish |
PEG Ratio | 1.15 | Bullish |
Current Ratio | 1.28 | Bearish |
Return on Assets | 14.81% | Bullish |
Return on Equity | 34.01% | Bullish |
Profit Margin | 39.34% | Bullish |
ROIC-WACC Ratio | Positive | Bullish |
Dividend Yield | 3.56% | Bullish |
Microsoft Fundamental Analysis Snapshot
Microsoft shares pushed above a horizontal support zone and revealed the potential for a bullish head-and-shoulders pattern, but trading volumes have yet to confirm either. The Bull Bear Power Indicator turned bullish, driven higher by an ascending trendline, and could tip the scales in favor of bulls, allowing a continuation of the recent sentiment swing.
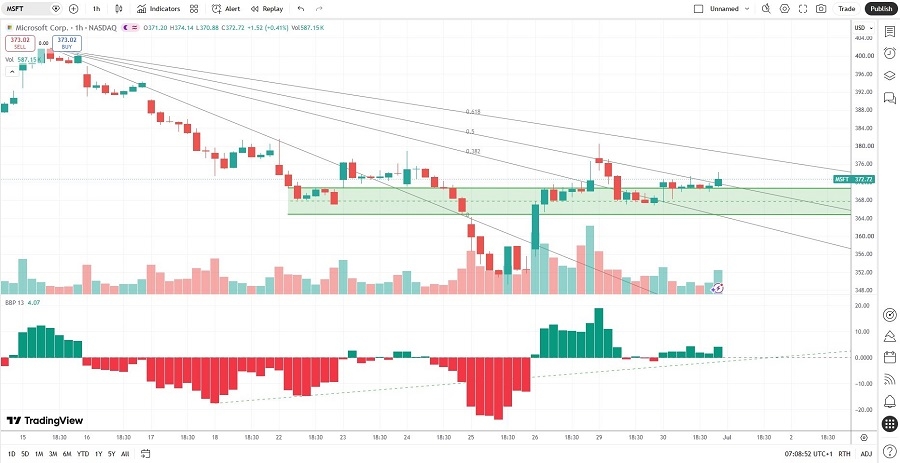
Microsoft Price Chart
The Underestimated Risks Behind Microsoft’s AI Value Story
Microsoft’s forward price-to-earning (P/E) ratio has fallen to 19.19, below the current S&P 500 P/E of 32.24 and trailing its own 10-year average of 27.00. Since price discounts all available information, have investors mispriced the upside potential, or is something else depressing Microsoft’s value in today’s complex market environment?
Despite Microsoft’s endeavor to fund the electricity usage of its AI data centers, it cannot eliminate the inflationary impact. Input costs continue to rise, and the final verdict on its competitive edge, backed by its infrastructure investments, has yet to be rendered. Still, Microsoft has multiple revenue streams with unlocked value, and the current bearish sentiment treats it as a loss-making AI play rather than an established leader in AI.
What today’s Microsoft Setup Reveals About Market Sentiment
Dominant bearish sentiment prevails, but analysts remain overall bullish with an average price target of $561.11. While it implies massive upside potential with reasonable downside risk and places Microsoft near the bottom of AI-dominant companies from a valuation perspective, volatility could increase as price action reaches a crucial juncture that could determine its direction over the next few sessions ahead for traders. More interesting than the price itself is whether and how trading volumes will confirm the next move.
What’s Next for Microsoft’s Price Action Around the Current Breakout Zone?
The pending bullish head-and-shoulders pattern presents an interesting chart setup to monitor, with trading volumes rising towards yesterday’s close, which took it just above the descending 50.0% Fibonacci Retracement Fan level. Today’s session could confirm the breakout and lead to more upside, with the $380.50 level the next to monitor. Does the valuation gap suffice to spur enough bullish sentiment for a breakout continuation?
Ready to trade our analysis of Microsoft? Here is our list of the best stockbrokers worth reviewing.