


Apple (NASDAQ:AAPL) became the world’s most valuable publicly traded company again, wrestling the title from NVIDIA (NASDAQ:NVDA), as it trades near record highs. Does a reported 33% production cut on the standard iPhone 17, paired with cooling App Store growth, suggest that the rally has finally outrun its fundamentals?
What does the disconnect between bullish price action and underlying bearish developments suggest about its earnings report, where analysts expect a solid beat?
Top Regulated Brokers
Why iPhone Production and App Store Growth Matter Now
High memory costs continue to weigh on consumers, and Apple’s price increases have accelerated demand destruction. After cutting iPhone 17 production by 15%, Apple has now slashed it by 33%, per supply chain reports from China. It adds to concerns that even heavy discounts are unable to boost demand, as outlined in last week’s note, “Apple’s China Discount Gambit Falls Short: Is Demand Cracking Beneath the Surface?”
Magnifying revenue concerns, Apple’s App Store growth rates are falling, with the US market leading the collapse with a 6% drop, while globally, App Store growth might clock in at 2%, down nearly 70%. Does Wall Street underestimate how much hardware and software growth has genuinely decelerated ahead of the next earnings release?
What the Market May Be Missing About Apple’s Growth
Bulls could be mispricing fading demand, hoping it is a normal late-cycle adjustment ahead of September’s iPhone 18 launch. Still, 12GB LPDDR5X module prices have roughly tripled since early 2025, squeezing the profit margins of Apple’s cheapest iPhone as demand appears to soften. Is it a sign that Apple’s most successful iPhone cycle on record is losing momentum faster than bulls have hoped?
Metric | Value | Verdict |
P/E Ratio | 40.47 | Bearish |
P/B Ratio | 46.03 | Bearish |
PEG Ratio | 2.69 | Bearish |
Current Ratio | 1.07 | Bearish |
Return on Assets | 26.23% | Bullish |
Return on Equity | 141.47% | Bullish |
Profit Margin | 27.15% | Bullish |
ROIC-WACC Ratio | Positive | Bullish |
Dividend Yield | 0.32% | Bearish |
Apple Fundamental Analysis Snapshot
Price action has retreated from 52-week highs, and a bearish price channel has formed, with average bearish trading volumes rising. The Bull Bear Power Indicator turned bearish with a descending trendline, but will the ascending 50.0% Fibonacci Retracement level hold?
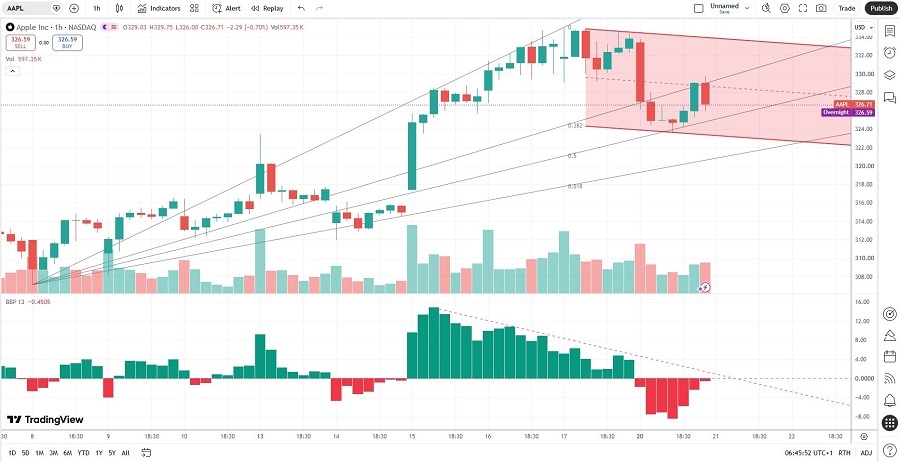
Apple Price Chart
What the Market May Be Missing About Apple’s Growth
Bulls argue that the iPhone 17 production cut is a normal late-cycle handoff ahead of September’s iPhone 18 launch, and that Apple posted a record first-quarter global shipment share of 21%, outgrowing a shrinking overall market. Is the stock’s premium valuation still justified once iPhone 17 production cuts and slowing App Store sales are priced in?
Apple’s Services segment, which many bulls consider its most reliable growth story, is experiencing a similar demand question as hardware sales. App Store growth, which has struggled, as evidenced by generative AI app revenue growth cooling from roughly 190% to under 100% year-over-year in recent months, does not account for iCloud, AppleCare, and search-related payments. Still, does it have the potential to add to a disappointing outlook?
Why Investors Remain Confident Despite Emerging Risks
Apple’s rally has taken price action above the average analyst price target of $318.25, suggesting no upside potential as downside risks and bearish catalysts accumulate. Is the market’s enthusiasm ahead of next week’s earnings report failing to account for a production cut and a services slowdown happening simultaneously?
Bulls have pushed Apple higher, suggesting Apple’s diversified ecosystem can absorb a slower hardware and App Store quarter. Is the market due for a reality check once the hardware and software growth numbers are out?
What Could Clarify Apple’s Near-Term Outlook
Price action broke down below its ascending 38.2% Fibonacci Retracement Fan levels, as confirmed by trading volume. With a production cut signaling caution on demand and App Store growth losing steam, is Apple’s premium valuation more fragile than the market currently reflects? The $323.66 level is the next crucial one that could determine the short-term direction, but will bulls defend it, or can bears claim it?
Ready to trade our analysis of Apple? Here is our list of the best stockbrokers worth checking out.