


Apple’s Component Cost Crunch: Are Memory Prices Now Threatening the Next iPhone Cycle?
Apple (NASDAQ: AAPL) has long been considered a fortress of stability in the tech sector. It has spent years shielding customers from volatile component markets, but is that cushion wearing thin?
Top Regulated Brokers
Surging costs for memory chips and storage, driven by AI data center demand, have already forced price hikes across several Apple products and services. Reports suggest memory costs for the upcoming iPhone 18 Pro have jumped by more than 270% year over year. Can Apple’s margins keep absorbing that pressure?
Why Surging Memory Costs Are Becoming Apple’s Central Problem
Apple raised prices on MacBooks, iPads, HomePod, and Apple TV in late June, citing memory costs it called unprecedented in speed and scale, a rare admission for a company that has long prided itself on price stability and tightly controlled component sourcing strategy. Engineering setbacks have resulted in launch delays, as outlined in last week’s note, “Do Engineering Setbacks Point to Mispriced Risk?,” and compound the component and pricing issues.
Rising input costs erode net margins, and memory supply contracts reset through the back half of the year. Reports indicate that Apple is now in talks with Chinese memory suppliers CXMT and YMTC to diversify away from Samsung and SK Hynix, but will it lower component costs meaningfully over time?
Apple’s Fundamentals and Price Action: What Current Metrics Signal About Risk
Management guided fiscal third-quarter gross margin to a range of 46.5% to 47.5%, a signal that component inflation could impact net profits as product delays threaten market share across key hardware categories. Apple has not provided clear evidence that pricing actions and supplier diversification are offsetting costs faster than memory prices are rising for its broader product lineup. How much more margin pressure can the share price handle before sentiment shifts?
Metric | Value | Verdict |
P/E Ratio | 37.81 | Bearish |
P/B Ratio | 42.57 | Bearish |
PEG Ratio | 2.49 | Bearish |
Current Ratio | 1.07 | Bearish |
Return on Assets | 26.23% | Bullish |
Return on Equity | 141.47% | Bullish |
Profit Margin | 27.15% | Bullish |
ROIC-WACC Ratio | Positive | Bullish |
Dividend Yield | 0.35% | Bearish |
Apple Fundamental Analysis Snapshot
Apple has advanced into a significant horizontal resistance zone, and bullish trading volume is fading. The Bull Bear Power Indicator is bullish but shows a negative divergence, hinting at increased volatility and a potential bearish crossover, as bearish trading volume rises.
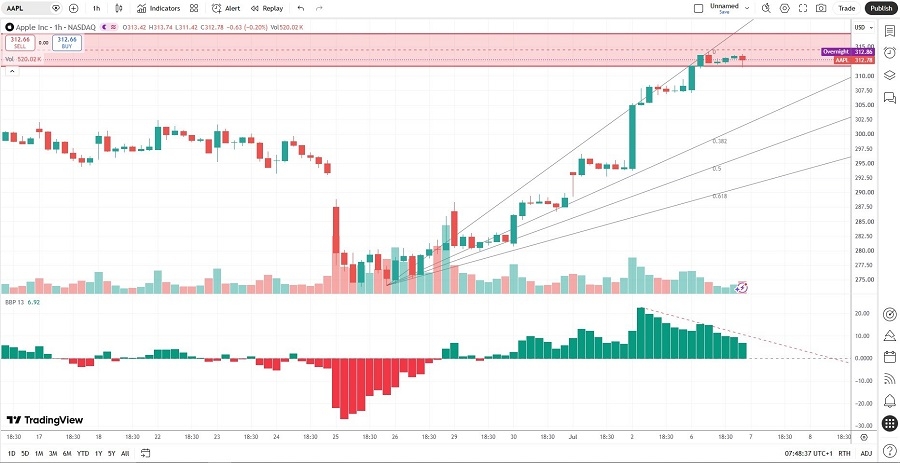
Apple Price Chart
The Underappreciated Risks Behind Apple’s Component Crunch and Delayed Launches
Apple has reportedly trimmed iPhone 17 production by around 15% as the lineup nears the end of its cycle, a normal step ahead of the iPhone 18 launch, but one that now comes amid serious cost pressure rather than in isolation. Its first foldable iPhone has also seen mass production slip by roughly one to two months, with engineering validation issues cited as the cause, pushing the timeline uncomfortably close to its planned debut. How will the component crunch and launch delays impact developer engagement?
Missing launch windows could deprive Apple of market share, dampen the premium pricing power it commands, and force software creators to delay building dedicated applications, which may impact Apple’s services revenue and magnify margin pressure.
What Today’s Setup Reveals About Market Sentiment Toward Apple’s Margin Pressure
The recent advance has taken price action to levels near the average analyst price target of $315.09, suggesting no upside potential, while downside risks are increasing. Does Wall Street ignore margin pressures, while hoping the iPhone 18 could repeat the euphoria and market share gains of the iPhone 17?
Rising component costs, production delays, and pricing power concerns suggest the market is becoming cautious while pricing shares for perfection, assuming seamless product transitions and uninterrupted consumer demand, which is a contradiction worth monitoring.
Key Levels to Watch as Component Costs and Delays Test Apple’s Bulls
Price action has entered a notable horizontal resistance zone. A breakdown below $308.62 could result in a counter trend move, but how will traders react if price action pierces above $317.40? Traders should also monitor price action and trading volumes once price action approaches the ascending 38.2% Fibonacci Retracement Fan level. Can margin pressures and product delays rally bearish sentiment?
Ready to trade our analysis of Apple? Here is our list of the best stockbrokers worth reviewing.