


Amazon (NASDAQ:AMZN) runs the world’s largest cloud platform, but the growth leaderboard has quietly re-ranked itself. AWS trails second-ranked Microsoft (NASDAQ:MSFT) Azure and market-leader Alphabet (NASDAQ:GOOG) Google Cloud in year-over-year growth rates. Does being the biggest and the slowest-growing hyperscaler undermine the case for Amazon’s unprecedented infrastructure spend?
The company’s 2026 capex is projected at roughly $200 billion, primarily for AI data centers. If AWS continues to lose market share, could some of its capacity become stranded assets?
Top Regulated Brokers
Why AWS Growth Is Falling Behind Azure and Google Cloud
According to a Synergy Research report, AWS is the largest spender among hyperscalers during its latest snapshot covering the first quarter of 2026, with roughly a 30% share of global cloud infrastructure spending, followed by Azure at nearly 25% and Google Cloud at approximately 14%. At the same time, its roughly 19%-28% annualized growth rates trail Azure’s 40% and Google Cloud’s 63%. The bond market has taken notice of this gap, as outlined in last week’s note, “Amazon’s Bond Market Cooldown: Is Weakening Demand a Sign of Deeper AI Strain?”
Amazon is losing momentum as AI demand grows despite leading in capex, and some analysts note that Azure’s revenue could eclipse AWS by 2030. How can Amazon justify its capex plans to investors while AWS trails its peers?
Amazon Debt, Fundamentals, and Technical Signals
Amazon has issued more than $100 billion in debt over the past year, and its first-quarter capex surged 60% year over year to over $43 billion, underscoring the scale of its expansion. CEO Andy Jassy insists that most of the new capacity is already wrapped into contracts. Should investors take that reassurance at face value when the growth gap versus peers keeps widening?
Metric | Value | Verdict |
P/E Ratio | 29.58 | Bearish |
P/B Ratio | 6.02 | Bearish |
PEG Ratio | 1.43 | Bullish |
Current Ratio | 1.18 | Bearish |
Return on Assets | 6.84% | Bearish |
Return on Equity | 24.29% | Bullish |
Profit Margin | 12.22% | Bullish |
ROIC-WACC Ratio | Positive | Bullish |
Dividend Yield | 0.00% | Bearish |
Amazon Fundamental Analysis Snapshot
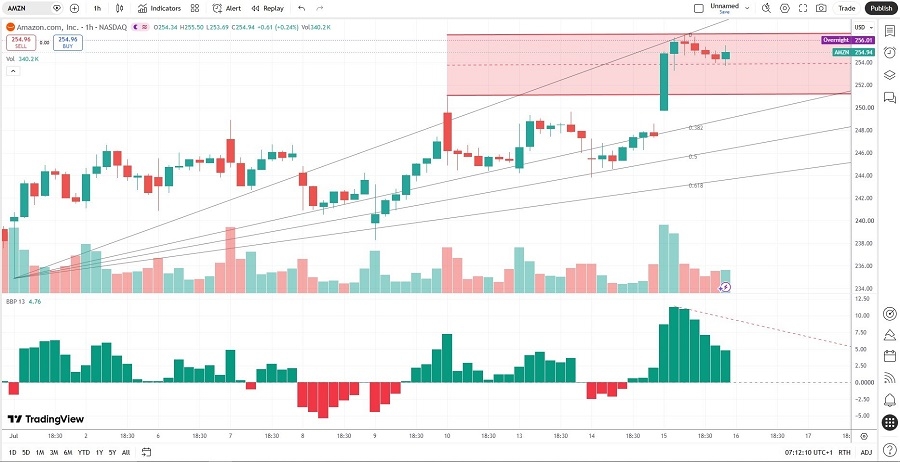
Price action has formed a new horizontal resistance zone after following the AI trend higher. The Bull Bear Power Indicator moved into bullish territory, but a descending trendline has formed, while average bearish trading volumes are generally higher than bullish ones.
Amazon Price Chart
Could Amazon’s AI Buildout Create a Stranded‑Asset Risk?
Amazon struggles with thinning margins and a below-average return on assets. Data centers, custom Trainium chips, and long-dated power agreements are capital-intensive investments and highly specific assets that cannot easily be transferred to other units or redeployed quickly elsewhere. AWS growth is lagging Azure’s OpenAI ecosystem or Google’s TPU stack, so how can bulls explain the massive capex?
Adding another layer to rising risk is regulatory friction, as evidenced by a moratorium on new AI data centers in New York. Yet bulls claim that demand justifies the debt-funded AI buildout, citing Amazon’s triple-digit growth rate in AI services, with revenue above $15 billion. Is that enough to absorb $200 billion in annual investment?
Equity Analysts vs. Credit Markets: Who Is Right About Amazon?
Despite decelerating AWS growth rates that notably lag competitors, even with the highest capex, the average analyst price target of $314.27 suggests attractive upside potential with elevated downside risk. Bulls appear willing to accept the massive drop in free cash flow, and equity analysts price Amazon for the AI opportunity.
On the other side of the trade are credit markets, which show greater concern, as judged by softer bond demand and wider spreads that price in funding risk. Which market is reading Amazon’s buildout correctly?
What’s Next for Amazon’s AI Story and AMZN Price Action?
Shares trade inside an untested horizontal resistance zone, and price action trades between the 0.0% and 38.2% Fibonacci Retracement Fan levels. Should AWS fail to close the gap with Azure and Google Cloud, will investors start viewing Amazon’s infrastructure as a pending liability rather than a growth asset? A breakdown below $251.00 could trigger more downside, but what if bulls push above $256.47?
Ready to trade our analysis of Amazon? Here is our list of the best stockbrokers worth reviewing.