
Wells Fargo (NYSE:WFC) stock signal, a fundamental snapshot, and a technical view on where its share price is heading. What to know before the market opens on June 18th, 2026, after WFC closed at $83.81, down 1.46% during the previous session, before advancing 0.29% in after-market hours.
Top Regulated Brokers
Short Trade Idea
Enter your short position between $83.59 (yesterday’s intra-day low) and $87.08 (the upper band of its horizontal resistance zone).
Market Index Analysis
Wells Fargo (NYSE:WFC) is a member of the S&P 100 Index and the S&P 500 Index.
Both indices trade near their all-time highs within bearish chart patterns and accumulating bearish catalysts.
The Bull Bear Power Indicator for the S&P 500 Index is bullish with a descending trendline, trending toward a bearish crossover.
Market Sentiment Analysis
Equity futures are moving higher following yesterday’s sell-off after Fed Chair Warsh held his first meeting, made drastic changes to the Fed statement, and half of the voting members signaled an interest rate hike. The US and Iran signed an interim peace deal, oil prices dropped after the IEA hinted at demand destruction, and Microsoft walked away from a $3 billion Oracle cloud deal.
Wells Fargo Fundamental Analysis
Wells Fargo is a banking conglomerate serving over 70 million customers in more than 35 countries. It is one of the Big Four Banks in the US and remains classified as a systemically important financial institution by the Financial Stability Board.
So, why am I bearish on WFC despite its nearly 20% rally from recent lows?
While Wells Fargo has expanded its loan book, surpassing $1 trillion for the first time since 2020, I am wary of deteriorating credit quality in its Commercial and Industrial (C&I) portfolio. The previous quarter saw credit loss provisions surge 22% year-over-year to $1.1 billion, with net charge-offs spiking 71% to $360 million. I am equally concerned about NIM compression, which was down 20 basis points last quarter despite loan growth.
Metric | Value | Verdict |
P/E Ratio | 12.95 | Bullish |
P/B Ratio | 1.60 | Bullish |
PEG Ratio | 1.51 | Bearish |
Current Ratio | Unavailable | Bearish |
ROIC-WACC Ratio | Negative | Bearish |
Wells Fargo Fundamental Analysis Snapshot
The price-to-earnings (P/E) ratio of 12.95 makes WFC an inexpensive stock. By comparison, the P/E ratio for the S&P 500 Index is 31.98.
The average analyst price target for WFC is $96.11. This suggests moderate upside potential with rising downside risks.
Wells Fargo Technical Analysis
Today’s WFC Signal
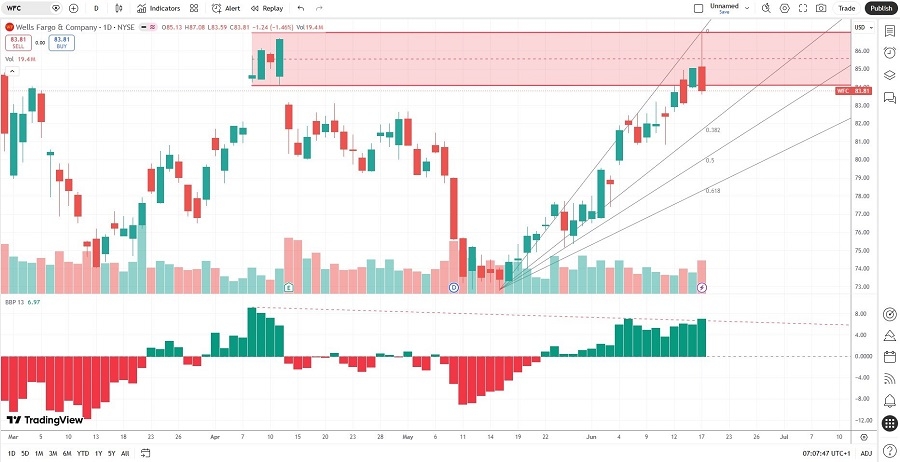
Wells Fargo Price Chart
The WFC D1 chart shows price action breaking down below its horizontal resistance zone.
It also shows price action between its ascending 0.0% and 38.2% Fibonacci Retracement Fan levels.
The Bull Bear Power Indicator is bullish with a descending trendline.
The average bearish trading volumes are higher than the average bullish trading volumes.
WFC advanced more than the S&P 500 Index, a bullish confirmation, but bearish catalysts are rising.
My WFC Short Stock Trade
WFC Entry Level: Between $83.59 and $87.08
WFC Take Profit: Between $69.56 and $72.78
WFC Stop Loss: Between $89.97 and $95.09
Risk/Reward Ratio: 2.20
Ready to trade our analysis of Wells Fargo? Here is our list of the best stockbrokers worth reviewing.