
Long Trade Idea
Enter your long position between $28.36 (the lower band of its horizontal support zone) and $30.81 (the upper band of its horizontal support zone).
Top Regulated Brokers
Market Index Analysis
Tractor Supply (NASDAQ:TSCO) is a member of the S&P 500 Index.
This index trades near its all-time high within a bearish chart pattern and accumulating bearish catalysts.
The Bull Bear Power Indicator for the S&P 500 Index is bullish with a descending trendline, trending toward a bearish crossover.
Market Sentiment Analysis
Equity futures are moving higher following yesterday’s sell-off after Fed Chair Warsh held his first meeting, made drastic changes to the Fed statement, and half of the voting members signaled an interest rate hike. The US and Iran signed an interim peace deal, oil prices dropped after the IEA hinted at demand destruction, and Microsoft walked away from a $3 billion Oracle cloud deal.
Tractor Supply Fundamental Analysis
Tractor Supply is an agricultural, lawn and garden maintenance, livestock, equine, and pet retailer with over 2,200 stores and plans to expand to 3,200 locations. It is also a Fortune 500 company.
So, why am I bullish on TSCO following its 55%+ correction?
Tractor Supply is poised for margin expansion after focusing on need-based consumables, usable, and edible categories like pet food, livestock feed, and maintenance items. The massive correction resulted in attractive valuations. Tractor Supply will benefit from its 11th distribution center and has experienced double-digit growth in online sales and final-mile delivery services. I am also bullish on its aggressive store expansion under its “Life Out Here 2030” strategy.
Metric | Value | Verdict |
P/E Ratio | 14.66 | Bullish |
P/B Ratio | 6.21 | Bearish |
PEG Ratio | 1.32 | Bullish |
Current Ratio | 1.38 | Bearish |
ROIC-WACC Ratio | Positive | Bullish |
Tractor Supply Fundamental Analysis Snapshot
The price-to-earnings (P/E) ratio of 14.66 makes TSCO an inexpensive stock. By comparison, the P/E ratio for the S&P 500 Index is 31.98.
The average analyst price target for TSCO is $45.22. This suggests excellent upside potential and fading downside risks.
Tractor Supply Technical Analysis
Today’s TSCO Signal
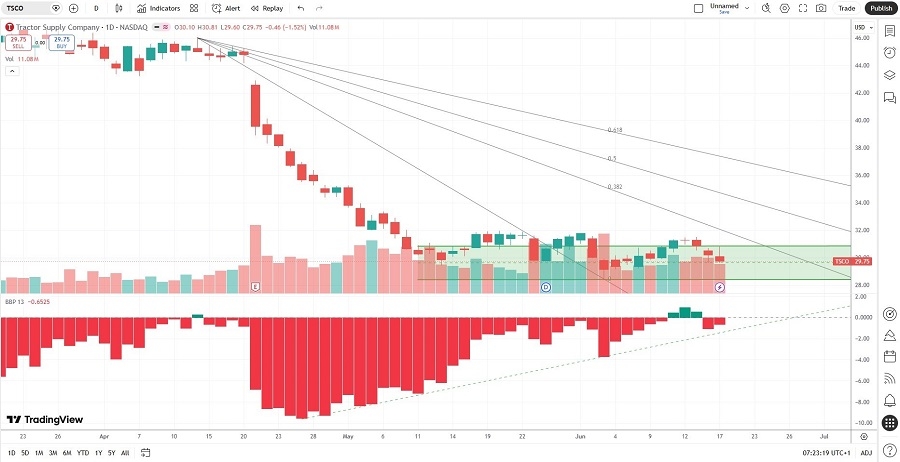
Tractor Supply Price Chart
The TSCO D1 chart shows price action inside a horizontal support zone.
It also shows price action between its descending 0.0% and 38.2% Fibonacci Retracement Fan levels.
The Bull Bear Power Indicator is bearish with an ascending trendline, approaching a bullish crossover.
The average bullish trading volumes are higher than the average bearish trading volumes since attempting a breakout.
TSCO trended sideways as the S&P 500 Index advanced, a bearish signal, but breakout catalysts have emerged.
My TSCO Long Stock Trade
TSCO Entry Level: Between $28.36 and $30.81
TSCO Take Profit: Between $43.23 and $46.00
TSCO Stop Loss: Between $23.23 and $25.34
Risk/Reward Ratio: 2.90
Ready to trade our analysis of Tractor Supply? Here is our list of the best stockbrokers worth reviewing.