
Short Trade Idea
Enter your short position between $100.25 (yesterday’s intra-day low) and $103.30 (the upper band of its horizontal resistance zone).
Top Regulated Brokers
Market Index Analysis
Paychex (NASDAQ:PAYX) is a member of the NASDAQ 100 Index and the S&P 500 Index.
Both indices trade near their all-time highs, but bullish trading volumes are decreasing and do not confirm the current three-day rally.
The Bull Bear Power Indicator for the S&P 500 Index turned bullish but remains below its descending trendline.
Market Sentiment Analysis
Equity futures hold value this morning as markets look for the next catalysts and as the US Federal Reserve starts its meeting under new Chair Warsh. Most investors zero in on interest rates, but the massive balance sheet remains largely ignored, which could affect market liquidity and cause more issues than interest rates do. Oil prices hover near $80, and despite renewed hopes for a lasting US-Iran peace deal, concerns about a global slowdown persist.
Paychex Fundamental Analysis
Paychex is a human resources, payroll, and employee benefits company focused on small- to medium-sized businesses. It has over 100 offices and serves over 740,000 clients across the US and Europe.
So, why am I bearish on PAYX despite its recent 20%+ rally?
The ongoing risk of a white-collar recession has led analysts to downgrade their revenue expectations to just 3.5% annualized organic growth, while Paychex trades at a valuation that requires significantly better performance. Current macroeconomic headwinds are leading to decreased ARPU (average revenue per user), as competition from other HCM providers applies downside pressure on its revenue potential. PAYX also deals with ongoing integration costs and margin compression from its Paycor acquisition.
Metric | Value | Verdict |
P/E Ratio | 22.27 | Bullish |
P/B Ratio | 8.98 | Bearish |
PEG Ratio | 1.75 | Bearish |
Current Ratio | 1.15 | Bearish |
ROIC-WACC Ratio | Positive | Bullish |
Paychex Fundamental Analysis Snapshot
The price-to-earnings (P/E) ratio of 22.27 makes PAYX an inexpensive stock. By comparison, the P/E ratio for the S&P 500 Index is 32.59.
The average analyst price target for PAYX is $105.07. This suggests negligible upside potential with rising downside risks.
Paychex Technical Analysis
Today’s PAYX Signal
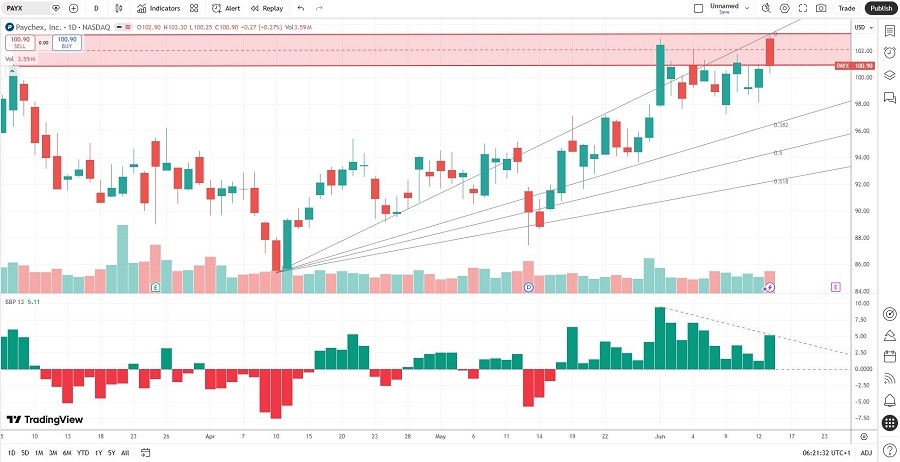
Paychex Price Chart
The PAYX D1 chart shows price action breaking down below its horizontal resistance zone.
It also shows price action between its ascending 0.0% and 38.2% Fibonacci Retracement Fan levels.
The Bull Bear Power Indicator is bullish with a negative divergence.
The average bearish trading volumes are higher than the average bullish trading volumes.
PAYX rallied more than the S&P 500 Index, a bullish confirmation, but breakdown catalysts heading into its earnings release are rising.
My PAYX Short Stock Trade
PAYX Entry Level: Between $100.25 and $103.30
PAYX Take Profit: Between $83.99 and $86.24
PAYX Stop Loss: Between $108.22 and $111.47
Risk/Reward Ratio: 2.04
Ready to trade our analysis of Paychex? Here is our list of the best stockbrokers worth checking out.