
Short Trade Idea
Enter your short position between $44.56 (an intermediate horizontal support level) and $46.10 (yesterday’s intra-day high).
Market Index Analysis
Nike (NYSE:NKE) is a member of the S&P 100 Index and the S&P 500 Index.
Both indices trade inside bearish chart patterns near their all-time highs, alongside rising breakdown catalysts.
The Bull Bear Power Indicator for the S&P 500 Index is bullish but remains below its descending trendline.
Market Sentiment Analysis
Equity futures are drifting higher this morning after a tech-led sell-off drove the S&P 500 Index and the NASDAQ Index lower, while Oil trades below $80 per barrel as the US and Iran agreed to a 14-point peace proposal. Markets await today’s Federal Reserve decision, with interest rates likely to remain on hold, but changes to the Fed under Warsh could emerge, and he will get his first chance to communicate his view on future monetary policy.
Top Regulated Brokers
Nike Fundamental Analysis
Nike is the world’s largest athletic footwear and apparel manufacturer, one of the leading sports equipment manufacturers, and the most valuable sports brand.
So, why am I bearish on NKE at current levels?
Nike continues to receive analyst downgrades as the recovery under CEO Hill is progressing more slowly than hoped, while the scope is notably narrower than its current share price suggests. I expect another leg lower during its next earnings release at the end of June amid disappointing guidance, magnified by ongoing market share loss to China, where Nike guided towards a 20% annualized sales decline, with Anta and Li-Ning taking significant market share from Nike. Its inventory correction cycle, which adds to margin compression, reinforces my bearish outlook.
Metric | Value | Verdict |
P/E Ratio | 29.63 | Bearish |
P/B Ratio | 4.75 | Bearish |
PEG Ratio | 1.58 | Bearish |
Current Ratio | 2.14 | Bullish |
ROIC-WACC Ratio | Positive | Bullish |
Nike Fundamental Analysis Snapshot
The price-to-earnings (P/E) ratio of 29.63 makes NKE an expensive stock in its sector. By comparison, the P/E ratio for the S&P 500 Index is 32.39.
The average analyst price target for NKE is $59.58. This suggests good upside potential, but downside risks are excessive.
Nike Technical Analysis
Today’s NKE Signal
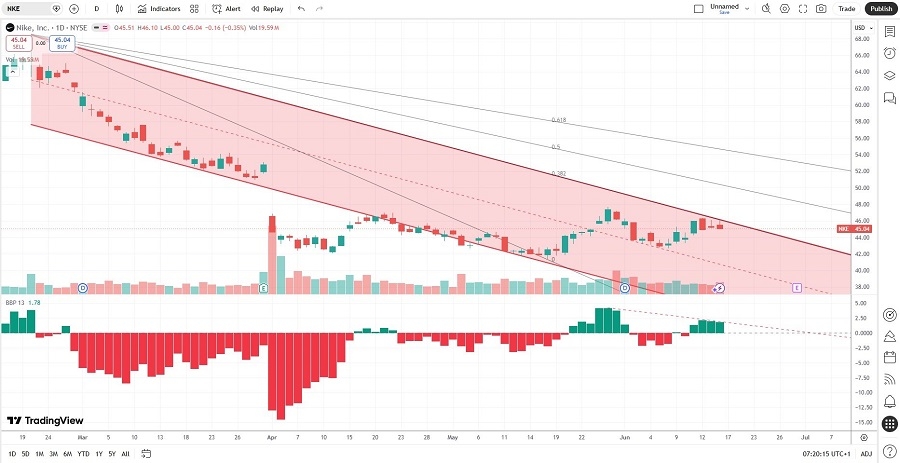
Nike Price Chart
The NKE D1 chart shows price action inside a bearish price channel.
It also shows price action between its descending 0.0% and 38.2% Fibonacci Retracement Fan levels.
The Bull Bear Power Indicator is bullish with a descending trendline.
The average bearish trading volumes are higher than the average bullish trading volumes.
NKE trended lower as the S&P 500 Index recovered, a significant bearish signal.
My NKE Short Stock Trade
NKE Entry Level: Between $44.56 and $46.10
NKE Take Profit: Between $31.30 and $34.92
NKE Stop Loss: Between $50.95 and $53.11
Risk/Reward Ratio: 2.08
Ready to trade our analysis of Nike? Here is our list of the best stock brokers worth reviewing.