
Top Regulated Brokers
Long Trade Idea
Enter your long position between $153.84 (the lower band of its horizontal support zone) and $160.72 (the upper band of its horizontal support zone).
Market Index Analysis
Equifax (NYSE:EFX) is a member of the S&P 500 Index.
This index trades near its all-time high within a bearish chart pattern and accumulating bearish catalysts.
The Bull Bear Power Indicator for the S&P 500 Index is bullish with a descending trendline, trending toward a bearish crossover.
Market Sentiment Analysis
Equity futures are moving higher following yesterday’s sell-off after Fed Chair Warsh held his first meeting, made drastic changes to the Fed statement, and half of the voting members signaled an interest rate hike. The US and Iran signed an interim peace deal, oil prices dropped after the IEA hinted at demand destruction, and Microsoft walked away from a $3 billion Oracle cloud deal.
Equifax Fundamental Analysis
Equifax is a consumer credit reporting agency and is part of the Big Three, alongside Experian and TransUnion. It collects data on over 800 million consumers and 88 million businesses globally.
So, why am I bullish on EFX despite its recent sell-off?
Equifax is on track to meet its double-digit full-year revenue and earnings-per-share guidance, supported by volume expansion and rising operating margins. Its Workforce Solutions, especially the Verification Services and Government segment, drives revenue growth amid double-digit growth in government contracts. I am also bullish on its AI-driven product innovation, including credit abuse risk, synthetic identity risk, and the Ataeva Product Suite, which helps margin expansion and results in analyst upgrades.
Metric | Value | Verdict |
P/E Ratio | 27.26 | Bullish |
P/B Ratio | 4.06 | Bearish |
PEG Ratio | 1.53 | Bearish |
Current Ratio | 0.61 | Bearish |
ROIC-WACC Ratio | Positive | Bullish |
Equifax Fundamental Analysis Snapshot
The price-to-earning (P/E) ratio of 27.26 makes EFX an inexpensive stock. By comparison, the P/E ratio for the S&P 500 Index is 31.98.
The average analyst price target for EFX is $222.90. This suggests excellent upside potential with manageable downside risks.
Equifax Technical Analysis
Today’s EFX Signal
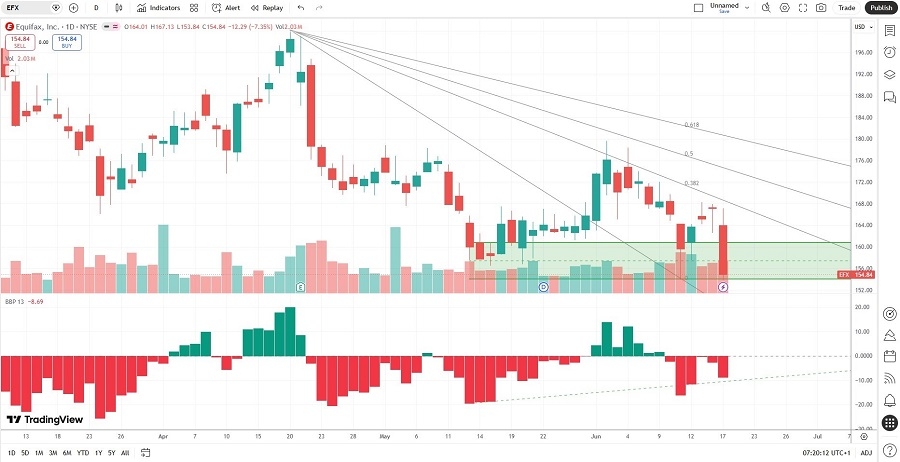
Equifax Price Chart
The EFX D1 chart shows price action inside its horizontal support zone.
It also shows price action between its descending 0.0% and 38.2% Fibonacci Retracement Fan levels.
The Bull Bear Power Indicator is bearish with an ascending trendline.
The average bearish trading volumes are higher than the average bullish trading volumes, hinting at short-term volatility potential.
EFX corrected as the S&P 500 Index recovered, a bearish confirmation, but bullish catalysts are accumulating.
My EFX Long Stock Trade
EFX Entry Level: Between $153.84 and $160.72
EFX Take Profit: Between $194.77 and $200.09
EFX Stop Loss: Between $135.98 and $143.21
Risk/Reward Ratio: 2.29
Ready to trade our analysis of Equifax? Here is our list of the best stockbrokers worth reviewing.