
Short Trade Idea
Enter your short position between $51.40 (the lower band of its horizontal resistance zone) and $53.93 (the upper band of its horizontal resistance zone).
Top Regulated Brokers
Market Index Analysis
CarMax (NYSE:KMX) is a member of the S&P 500 Index.
This index trades near all-time highs within a bearish chart pattern.
The Bull Bear Power Indicator for the S&P 500 Index is bullish with a descending trendline.
Market Sentiment Analysis
Equity futures are lower this morning as markets digest progress in US-Iran peace negotiations, in which both sides agreed to a 60-day window to finalize talks. Oil prices are likely to remain elevated, and all eyes are on Thursday’s Personal Consumption Expenditures price index, the Federal Reserve’s preferred inflation gauge, especially following last week’s more hawkish tone.
CarMax Fundamental Analysis
CarMax is the largest used vehicle retailer in the US. It operates two business units: CarMax Sales Operations and CarMax Auto Finance. Its multichannel platform supports both online and in-store purchases, with options for home delivery and contactless curbside pickup.
So, why am I bearish on KMX following its post-earnings volatility?
CarMax beat revenue and earnings-per-share expectations of $7.42 billion and $0.97, respectively, reporting $8.01 billion and $1.31. Shares plunged nearly 9% and rallied over 13% in the following two sessions. Still, profit margins have contracted, and I am equally bearish on liquidity concerns with a 0.6 interest coverage ratio, confirming that current earnings are insufficient to cover interest expenses.
Metric | Value | Verdict |
P/E Ratio | 33.33 | Bearish |
P/B Ratio | 1.24 | Bullish |
PEG Ratio | 0.55 | Bullish |
Current Ratio | 2.70 | Bullish |
ROIC-WACC Ratio | Negative | Bearish |
CarMax Fundamental Analysis Snapshot
The price-to-earning (P/E) ratio of 33.33 makes KMX an expensive stock. By comparison, the P/E ratio for the S&P 500 Index is 32.23.
The average analyst price target for KMX is $49.46. This suggests no upside potential with elevated downside risks.
CarMax Technical Analysis
Today’s KMX Signal
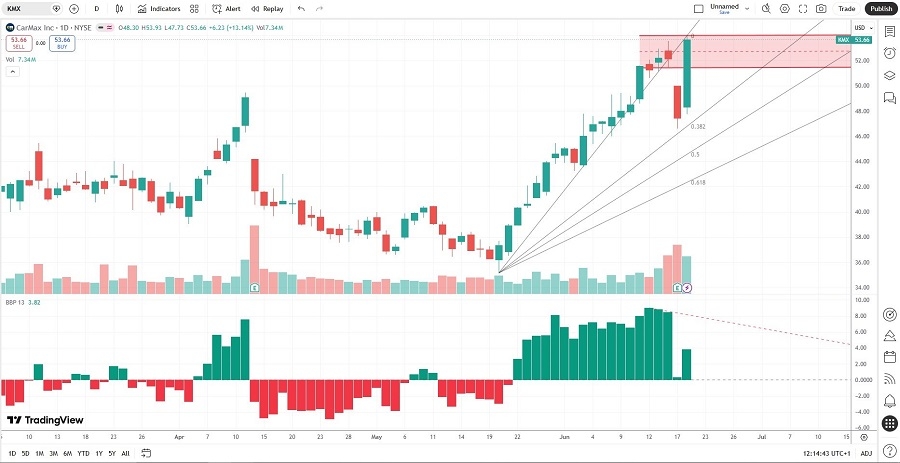
CarMax Price Chart
The KMX D1 chart shows price action inside a horizontal resistance zone.
It also shows price action between its ascending 0.0% and 38.2% Fibonacci Retracement Fan levels.
The Bull Bear Power Indicator is bullish with a negative divergence.
The average bearish trading volumes are higher than the average bullish trading volumes.
KMX outperformed the S&P 500 Index over the past week, a bullish sign, but bearish catalysts are accumulating.
My KMX Short Stock Trade
KMX Entry Level: Between $51.40 and $53.93
KMX Take Profit: Between $40.48 and $43.24
KMX Stop Loss: Between $56.55 and $58.45
Risk/Reward Ratio: 2.12
Ready to trade our analysis of CarMax? Here is our list of the best stockbrokers worth checking out.