
Short Trade Idea
Enter your short position between $77.24 (yesterday’s intra-day low) and $79.51 (the upper band of its horizontal resistance zone).
Top Regulated Brokers
Market Index Analysis
Best Buy (NYSE:BBY) is a member of the S&P 500 Index.
This index trades near its all-time high, but bullish trading volumes are decreasing and do not confirm the current three-day rally.
The Bull Bear Power Indicator for the S&P 500 Index turned bullish but remains below its descending trendline.
Market Sentiment Analysis
Equity futures hold value this morning as markets look for the next catalysts and as the US Federal Reserve starts its meeting under new Chair Warsh. Most investors zero in on interest rates, but the massive balance sheet remains largely ignored, which could affect market liquidity and cause more issues than interest rates do. Oil prices hover near $80, and despite renewed hopes for a lasting US-Iran peace deal, concerns about a global slowdown persist.
Best Buy Fundamental Analysis
Best Buy is a consumer electronics retailer undergoing an ongoing transition to a multichannel, online-first model. It also produces in-house products under eight brands.
So, why am I bearish on BBY amid its post-earnings rally?
Best Buy reported revenues of $8.94 billion and earnings per share of $1.28, besting estimates of $8.82 billion and $1.23, respectively. Still, I turned bearish as management maintained its full-year guidance despite a strong May performance, suggesting caution ahead on big-ticket discretionary spending, driven by notable weakness in its appliances and consumer electronics segment. The housing market’s stagnation magnifies revenue concerns, while the risk of demand destruction heightens margin pressures.
Metric | Value | Verdict |
P/E Ratio | 14.34 | Bullish |
P/B Ratio | 5.37 | Bearish |
PEG Ratio | 1.50 | Bearish |
Current Ratio | 1.12 | Bearish |
ROIC-WACC Ratio | Positive | Bullish |
Best Buy Fundamental Analysis Snapshot
The price-to-earnings (P/E) ratio of 14.34 makes BBY an inexpensive stock. By comparison, the P/E ratio for the S&P 500 Index is 32.59.
The average analyst price target for BBY is $78.65. This suggests no upside potential, while downside risks are accelerating.
Best Buy Technical Analysis
Today’s BBY Signal
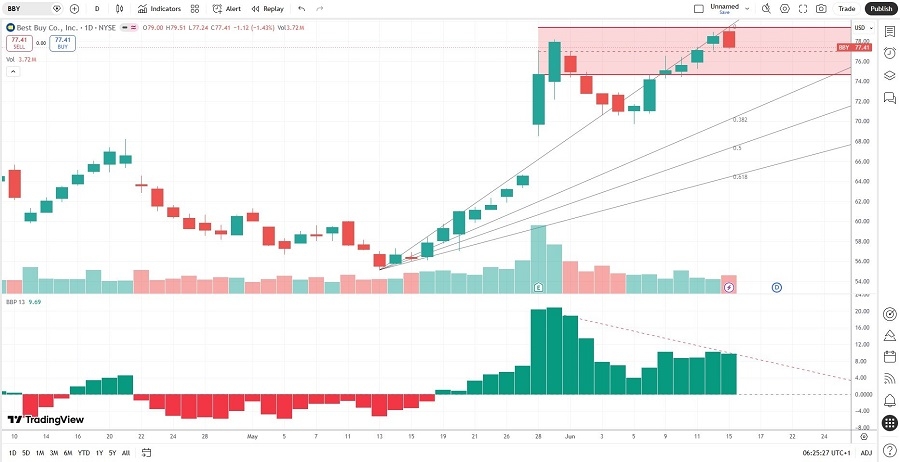
Best Buy Price Chart
The BBY D1 chart shows price action inside a horizontal resistance zone.
It also shows price action between its ascending 0.0% and 38.2% Fibonacci Retracement Fan levels.
The Bull Bear Power Indicator is bullish with a negative divergence.
The average bearish trading volumes are higher than the average bullish trading volumes since the post-earnings rally.
BBY outperformed the S&P 500 Index, a bullish confirmation, but breakdown catalysts are rising.
My BBY Short Stock Trade
BBY Entry Level: Between $77.24 and $79.51
BBY Take Profit: Between $63.31 and $66.26
BBY Stop Loss: Between $84.16 and $86.68
Risk/Reward Ratio: 2.01
Ready to trade our analysis of Best Buy? Here is our list of the best stockbrokers worth checking out.