
Top Regulated Brokers
Amazon (NASDAQ:AMZN) continues to print capital expenditure data that leads the pack, but does it justify the hype, or does it clash with fundamentals? When weighing AI capital expenditures against a fragile chart, a story with two tales emerges, but traders and investors are going to have to choose one of them to believe in.
Recent AI enthusiasm fatigue and questions concerning the viability of funding premium AI models versus low-cost commoditized competitors have punished the sector overall, but is the Amazon case justified?
Why Does Capital Expenditures Matter Now?
The ongoing implementation of AI, or more precisely, the underlying infrastructure that powers advanced AI models, is a very capital-intensive business. Besides infrastructure, including data centers, talent attraction and retention for the software side of the AI equation are crucial to creating the kind of competitive edge that is so vital to Amazon. Therefore, capital expenditures are necessary, but the question is how much to spend to justify future revenue and income generation, and when will such capital expenditure become a self-destructive downward spiral for the company.
Amazon has the capacity to win this race with a massive capital expenditure budget, but underlying metrics have created an uncomfortable development that warrants more scrutiny, which helps explain the current sentiment. Will it prevail?
Amazon Facts Worth Considering Today
Amazon faces rising bearish sentiment and a mismatch between having the highest capital expenditure and the most bearish fundamental headwinds. Despite its massive $200 billion 2026 capex budget, Amazon has not attracted more top-tier talent or developed premium AI models to ensure a competitive edge. Therefore, investors rightly ask and experience anxiety over the current business plan.
Metric | Value | Verdict |
P/E Ratio | 31.66 | Bearish |
P/B Ratio | 6.43 | Bearish |
PEG Ratio | 1.83 | Bearish |
Current Ratio | 1.18 | Bearish |
Return on Assets | 6.84% | Bearish |
Return on Equity | 24.29% | Bullish |
Profit Margin | 12.22% | Bullish |
ROIC-WACC Ratio | Positive | Bullish |
Dividend Yield | 0.00% | Bearish |
Amazon Fundamental Analysis Snapshot
Price action is descending within a bearish price channel, and the latest move down from the upper band was confirmed by rising bearish trading volume as the sell-off gathered pace. The Bull Bear Power Indicator turned bearish, and a descending trendline could limit any reversal attempts.
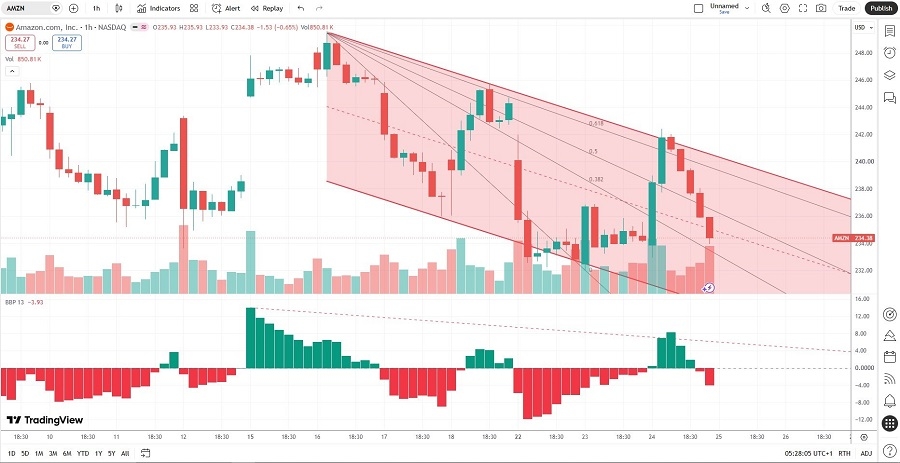
Amazon Price Chart
Concerns Over Amazon’s Revenue and Asset Utilization
Amazon justifies its $200 billion capital expenditures with a 28% year-over-year rise in AWS, its cloud unit that accounts for the bulk of the budget. Yet, it trails Microsoft (NASDAQ:MSFT), which reported cloud revenue growth of 40%, and Alphabet (NASDAQ:GOOG), which leads the pack with a 63% increase. Still, both competitors have smaller capex budgets and report a superior return on assets.
The asset utilization at Amazon is a warning sign that markets are beginning to scrutinize, and while Amazon could take steps to improve it, as it is less than 50% of Microsoft and Alphabet, it has shown no signs of doing so. Amazon benefits from its massive e-commerce business, which can buffer short-term capital expenditure anxiety, but it cannot compensate for it.
Yet Analyst Targets for Amazon Remain Bullish
Despite its ongoing correction, the average analyst price target of $312.99 suggests attractive upside potential over the medium to long term outlook, but valuation includes a premium that may or may not justify the current business model, dependent on how investors gauge the crosscurrents. AI monetization could emerge as a stealth bullish catalyst if Amazon can navigate challenging macroeconomic issues, while Amazon’s Trainium and Graviton chips rank among the top three data center chips, but will they suffice to ease capital expenditure anxiety?
What’s Next for Amazon?
Price action currently trades between its descending 38.2% and 50.0% Fibonacci Retracement Fan levels within a well-established bearish price channel, confirmed by steadily rising bearish trading volumes. Does the bearish sentiment accurately reflect underlying weakness in asset utilization and adequately question ongoing capital expenditures? The $232.32 level could provide the next important clue and offer short-term directional guidance.
Ready to trade our analysis of Amazon? Here is our list of the best stockbrokers worth reviewing.