
Short Trade Idea
Enter your short position between $171.15 (Friday’s intra-day low) and $179.99 (Friday’s intra-day high).
Market Index Analysis
Qualcomm (NASDAQ:QCOM) is a member of the NASDAQ 100 Index, the S&P 100 Index, and the S&P 500 Index.
All three indices are climbing a wall of worry and ignoring medium-term issues that accumulate.
The Bull Bear Power Indicator for the NASDAQ 100 Index is bullish with a negative divergence.
Market Sentiment Analysis
Equity futures hover near record highs despite tensions persisting over the Strait of Hormuz. Meme stock GameStop made a bold acquisition offer for e-commerce retailer eBay, trying to compete with Amazon at a $56 billion price tag, a move that had been rumored for weeks. Lattice Semiconductor Corporation, Advanced Micro Devices, Arm Holdings, Palantir, and Paramount Skydance highlight this week’s earnings reports.
Qualcomm Fundamental Analysis
Qualcomm is a semiconductor and software company catering to wireless technology. It owns patents vital to the 5G, 4G, CDMA2000, TD-SCDMA, and WCDMA mobile communications standards. It has also begun expanding into non-mobile sectors to diversify its business.
So, why am I bearish on QCOM despite its earnings beat?
Qualcomm reported revenues of $10.6 billion, matching expectations, while earnings per share of $2.65 beat expectations of $2.56. While QCOM has had an impressive run since my buy recommendation, I turned short-term bearish amid the loss of key customers, including Apple, and slow diversification into data centers and automation, which cannot offset smartphone weakness this year. Qualcomm also faces ongoing margin pressures.
Metric | Value | Verdict |
P/E Ratio | 19.06 | Bullish |
P/B Ratio | 6.84 | Bearish |
PEG Ratio | 0.76 | Bullish |
Current Ratio | 2.37 | Bullish |
ROIC-WACC Ratio | Positive | Bullish |
Qualcomm Fundamental Analysis Snapshot
The price-to-earning (P/E) ratio of 19.06 makes QCOM an inexpensive stock. In comparison, the P/E ratio for the NASDAQ 100 Index is 36.16.
The average analyst price target for QCOM is $168.50. This suggests no upside potential with elevated downside risks.
Qualcomm Technical Analysis
Today’s QCOM Signal
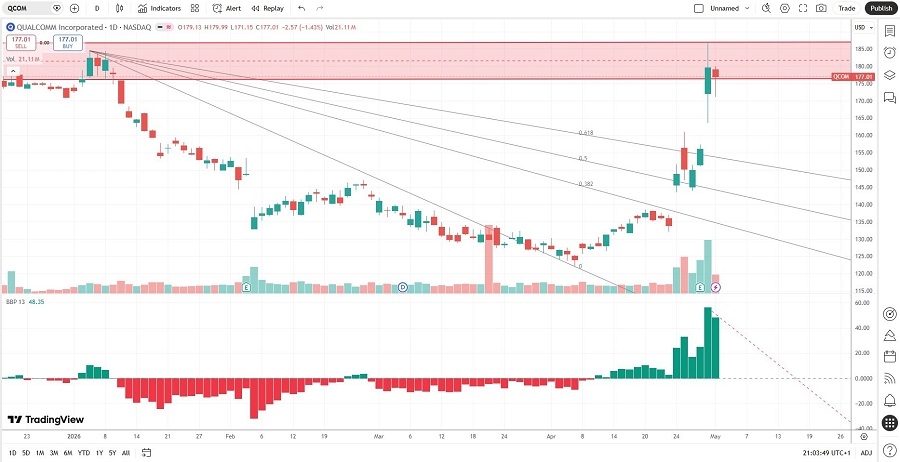
Qualcomm Price Chart
The QCOM D1 chart shows price action inside its horizontal resistance zone.
It also shows price action above its descending Fibonacci Retracement Fan.
The Bull Bear Power Indicator spiked into unsustainable bullish conditions with a descending trendline.
The average bullish trading volumes are higher than the average bearish trading volumes, suggesting more potential short-term volatility ahead.
QCOM rallied with the NASDAQ 100 Index, a bullish confirmation, but bearish catalysts are accumulating.
My QCOM Short Stock Trade
QCOM Entry Level: Between $171.15 and $179.99
QCOM Take Profit: Between $132.05 and $138.26
QCOM Stop Loss: Between $190.63 and $196.35
Risk/Reward Ratio: 2.01
Ready to trade our analysis of Qualcomm? Here is our list of the best stockbrokers worth checking out.