


Short Trade Idea
Enter your short position between $214.80 (Friday’s intra-day low) and $221.01 (Friday’s intra-day high).
Market Index Analysis
NVIDIA (NASDAQ:NVDA) is a member of the NASDAQ 100 Index, the Dow Jones Industrial Average Index, the S&P 100 Index, and the S&P 500 Index.
All four indices trade near all-time highs, driven by an AI frenzy reminiscent of the 1700s French stock market.
The Bull Bear Power Indicator for the NASDAQ 100 Index is bullish with a negative divergence.
Market Sentiment Analysis
Equity markets enter the final trading week near all-time highs, and the start of the week is bullish as oil prices dropped towards $90 per barrel amid hopes of a deal despite mixed messaging from the US and Iran. Consumer confidence continues to retreat, while borrowing costs are at decade highs. Earnings from Marvell Technology, Salesforce, Costco Wholesale, Dell Technologies, Dollar Tree, Best Buy, and The Gap are on deck.
NVIDIA Fundamental Analysis
NVIDIA is a semiconductor company that emerged as the leading AI company. Originally catering to gamers with high-end GPUs, it broadened into AI, and its tremendous success made it the first company to reach a $5 trillion market cap.
So, why am I bearish on NVDA despite its solid earnings report?
NVIDIA beat revenue and earnings-per-share expectations of $78.91 billion and $1.75, reporting $81.61 billion and $1.87, respectively. Still, I remain bearish as growth rates are slowing, and competition is heating up. NVDA also acknowledged that it had lost the Chinese market to Huawei, while hyperscalers began developing in-house chips. Rising borrowing costs, valuation compression, and the threat of shrinking margins equally weigh on shares.
Metric | Value | Verdict |
P/E Ratio | 33.03 | Bearish |
P/B Ratio | 26.68 | Bearish |
PEG Ratio | 0.66 | Bullish |
Current Ratio | 3.44 | Bullish |
ROIC-WACC Ratio | Positive | Bullish |
NVIDIA Fundamental Analysis Snapshot
The price-to-earnings (P/E) ratio of 33.03 makes NVDA an expensive stock. By comparison, the P/E ratio for the NASDAQ 100 Index is 35.89.
The average analyst price target for NVDA is $294.22. This suggests excellent upside potential, but downside risks remain elevated.
NVIDIA Technical Analysis
Today’s NVDA Signal
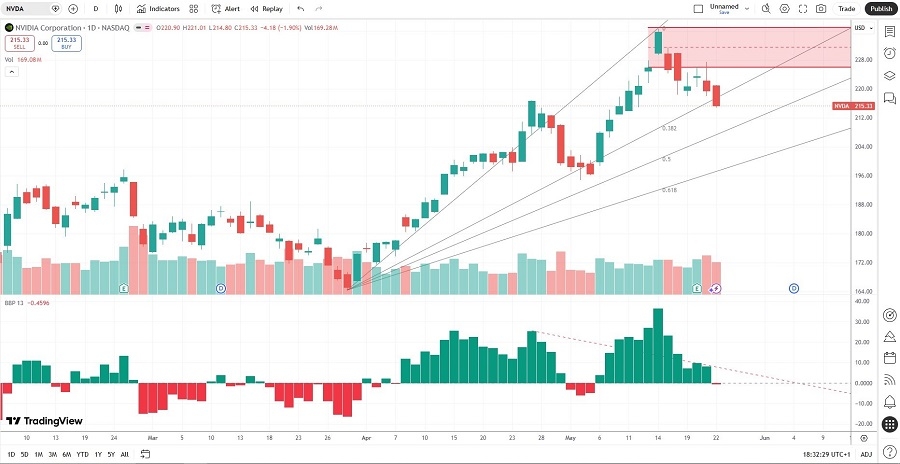
NVIDIA Price Chart
The NVDA D1 chart shows price action breaking down below its horizontal resistance zone.
It also shows price action between its ascending 38.2% and 50.0% Fibonacci Retracement Fan levels.
The Bull Bear Power Indicator turned bearish and remains below its descending trendline.
The average bearish trading volumes are higher than the average bullish trading volumes.
NVDA corrected as the NASDAQ 100 Index pushed higher, a significant bearish confirmation.
My NVDA Short Stock Trade
NVDA Entry Level: Between $214.80 and $221.01
NVDA Take Profit: Between $180.30 and $188.88
NVDA Stop Loss: Between $231.50 and $236.54
Risk/Reward Ratio: 2.07
Ready to trade our analysis of NVIDIA? Here is our list of the best stockbrokers worth reviewing.