
Short Trade Idea
Enter your short position between $155.69 (an intermediate horizontal support level) and $159.23 (an intermediate horizontal resistance level).
Market Index Analysis
Exxon Mobil (NYSE:XOM) is a member of the S&P 100 Index and the S&P 500 Index.
Both indices trade near all-time highs, resembling bubble conditions in France during the Mississippi Bubble that burst in 1720.
The Bull Bear Power Indicator for the S&P 500 Index is bullish with a negative divergence.
Market Sentiment Analysis
Equity futures point to a continuation of Friday’s sell-off as oil prices climb following US President Trump’s renewed threat against Iran if they fail to reach a deal quickly. The latest inflation data showed price pressures outside the energy sector, with core prices accelerating, increasing bets on an interest rate hike rather than a cut this year, and stoking more stagflation concerns. Earnings from NVIDIA, Walmart, and Target highlight this week’s earnings releases.
Exxon Mobil Fundamental Analysis
Exxon Mobil is an oil and gas company, the seventh-largest US company by revenue, the thirteenth-largest globally, and the largest investor-owned oil company in the world.
So, why am I bearish on XOM despite its post-earnings advance?
Exxon Mobil reported revenues of $85.14 billion and earnings per share of $1.16, beating expectations of $81.13 billion and $0.98, respectively. Geopolitical de-escalation risk with a potential end to the Iran war forms the core of my bearish view, as shares are priced higher on higher oil prices. Damage to the Qatar LNG facilities could result in an $800 million impairment charge, while oil price normalization risks could magnify cash flow compression driven by negative timing effects from derivatives and inventory accounting.
Metric | Value | Verdict |
P/E Ratio | 26.59 | Bearish |
P/B Ratio | 2.36 | Bearish |
PEG Ratio | 1.32 | Bullish |
Current Ratio | 1.04 | Bearish |
ROIC-WACC Ratio | Positive | Bullish |
Exxon Mobil Fundamental Analysis Snapshot
The price-to-earning (P/E) ratio of 26.59 makes XOM an expensive stock relative to its sector. By comparison, the P/E ratio for the S&P 500 Index is 31.90.
The average analyst price target for XOM is $167.86. This suggests moderate upside potential, but the downside risks are greater.
Exxon Mobil Technical Analysis
Today’s XOM Signal
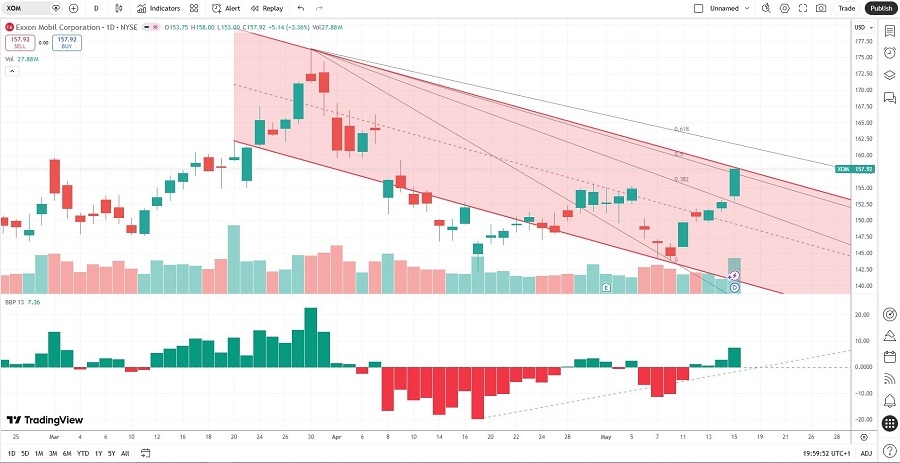
Exxon Mobil Price Chart
The XOM D1 chart shows price action inside a bearish price channel.
It also shows price action between its descending 50.0% and 61.8% Fibonacci Retracement Fan levels.
The Bull Bear Power Indicator is bearish with an ascending trendline, hinting at more short-term volatility potential.
The average bearish trading volumes are higher than the average bullish trading volumes.
XOM corrected as the S&P 500 Index rallied, a significant bearish confirmation.
My XOM Short Stock Trade
XOM Entry Level: Between $155.69 and $159.23
XOM Take Profit: Between $130.07 and $136.67
XOM Stop Loss: Between $167.86 and $176.14
Risk/Reward Ratio: 2.11
Ready to trade our analysis of XOM? Here is our list of the best stockbrokers worth reviewing.