
Short Trade Idea
Enter your short position between $939.29 (an intermediate horizontal support level) and $957.69 (an intermediate horizontal resistance level).
Market Index Analysis
Eli Lilly and Company (NYSE:LLY) is a member of the S&P 100 Index and the S&P 500 Index.
Both indices have recorded new all-time highs.
The Bull Bear Power Indicator for the S&P 500 Index remains bullish with a negative divergence.
Market Sentiment Analysis
Oil prices remain elevated, which is slowly fueling higher inflation for longer. Markets will receive fresh inflation data this week as earnings season slowly winds down. This has created potentially bubble-like conditions in the tech market led by semiconductors.
Eli Lilly and Company Fundamental Analysis
Eli Lilly and Company is a pharmaceutical company with offices in 18 countries. ELY is the most valuable pharmaceutical company worldwide and the 11th-largest biomedical company by revenue.
So, why am I bearish on LLY despite its earnings beat?
While Eli Lilly and Company beat revenue and earnings-per-share expectations of $17.82 billion and $6.97, respectively, reporting $19.80 billion and $8.55, I remain bearish amid oral obesity drug Foundayo (orforglipron), released last month, as it remains far behind Wegovy in comparable weeks, 3,700+ versus 18,400+ orders in week two of its launch. LLY also faces pricing and reimbursement pressures from Pharmacy Benefit Managers.
MLLYic | Value | Verdict |
P/E Ratio | 33.67 | Bearish |
P/B Ratio | 27.11 | Bearish |
PEG Ratio | 1.28 | Bullish |
Current Ratio | 1.50 | Bearish |
ROIC-WACC Ratio | Positive | Bullish |
Eli Lilly and Company Fundamental Analysis Snapshot
The price-to-earning (P/E) ratio of 33.67 makes LLY an expensive stock. By comparison, the P/E ratio for the S&P 500 Index is 31.83.
The average analyst price target for LLY is $1,209.14. This suggests that there is some excellent upside potential, but downside risks are greater.
Eli Lilly and Company Technical Analysis
Today’s LLY Signal
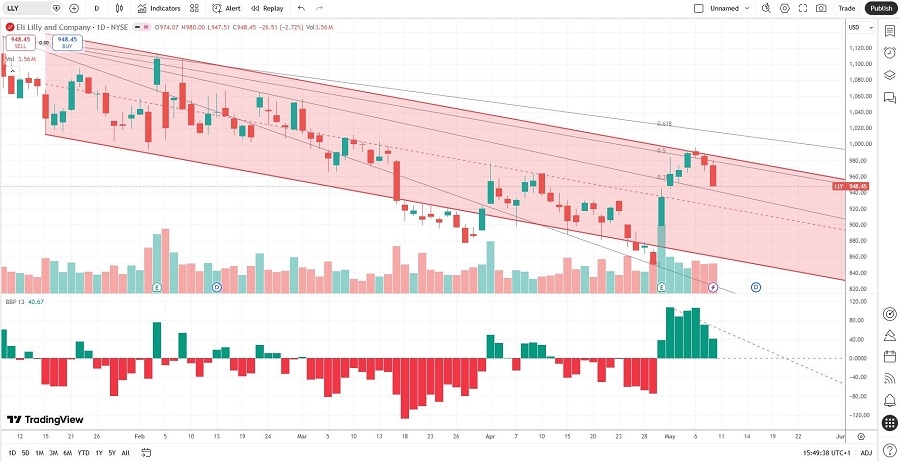
Eli Lilly and Company Price Chart
The LLY D1 chart shows price action inside a bearish price channel.
It also shows price action between its descending 38.2% and 50.0% Fibonacci Retracement Fan levels.
The Bull Bear Power Indicator is bullish with a descending trendline.
The average bearish trading volumes are higher than the average bullish trading volumes.
LLY corrected as the S&P 500 Index advanced, a significant bearish confirmation.
My LLY Short Stock Trade
LLY Entry Level: Between $939.29 and $957.69
LLY Take Profit: Between $783.85 and $809.63
LLY Stop Loss: Between $1,012.00 and $1,033.38
Risk/Reward Ratio: 2.14
Ready to trade our analysis of Eli Lilly and Company? Here is our list of the best stockbrokers worth reviewing.