


Short Trade Idea
Enter your short position between $996.16 (yesterday’s intra-day low) and $1,016.00 (an intermediate horizontal resistance level).
Market Index Analysis
Costco Wholesale Corporation (NASDAQ:COST) is a member of the NASDAQ 100 Index, the S&P 100 Index, and the S&P 500 Index.
All three indices recorded fresh all-time highs on bearish trading volumes, driven solely by AI-related companies, as the rest of the market underperforms.
The Bull Bear Power Indicator for the S&P 500 Index is bullish with a negative divergence.
Market Sentiment Analysis
Equity futures are wavering this morning but are mostly higher after Micron and SK Hynix topped $1 trillion in market cap for the first time, driven by the AI mania, which has pushed indices to record highs, a trend that could extend but slow its trajectory over the summer. Marvell Technology, Salesforce, Snowflake, and Abercrombie & Fitch will report earnings today, which could inject volatility.
Top Regulated Brokers
Costco Wholesale Corporation Fundamental Analysis
Costco Wholesale Corporation is one of the world’s largest retailers and the largest retailer of beef, poultry, organic produce, and wine. Over 30% of Americans regularly shop at Costco Wholesale Corporation, which drives value through its in-house brand. It currently has 905 warehouses serving more than 130 million members.
So, why am I bearish on COST at current levels?
Costco Wholesale Corporation remains extremely overvalued and lacks medium-term bullish catalysts. I expect COST to beat its earnings estimates, but for the sell-off to accelerate, like Walmart (NASDAQ:WMT), as they face the same macro and consumer environment. Competition continues to increase, with reports indicating decelerating renewal rates for Costco’s membership.
Metric | Value | Verdict |
P/E Ratio | 52.07 | Bearish |
P/B Ratio | 14.22 | Bearish |
PEG Ratio | 5.22 | Bearish |
Current Ratio | 1.06 | Bearish |
ROIC-WACC Ratio | Positive | Bullish |
Costco Wholesale Corporation Fundamental Analysis Snapshot
The price-to-earnings (P/E) ratio of 52.07 makes COST an expensive stock. By comparison, the P/E ratio for the S&P 500 Index is 32.41.
The average analyst price target for COST is $1,076.97. This suggests moderate upside potential with high downside risks.
Costco Wholesale Corporation Technical Analysis
Today’s COST Signal
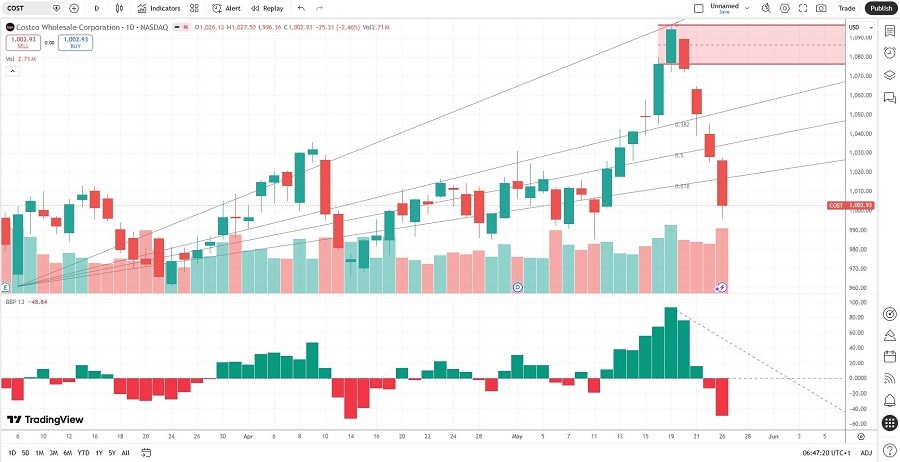
Costco Wholesale Corporation Price Chart
The COST D1 chart shows price action in a massive four-day breakdown below its horizontal resistance zone.
It also shows price action breaking down below its ascending Fibonacci Retracement Fan.
The Bull Bear Power Indicator turned bearish with a descending trendline.
The average bearish trading volumes are higher than the average bullish trading volumes.
COST sold off as the S&P 500 Index recorded a fresh all-time high, a significant bearish confirmation.
My COST Short Stock Trade
COST Entry Level: Between $996.16 and $1,016.00
COST Take Profit: Between $844.06 and $860.85
COST Stop Loss: Between $1,064.73 and $1,076.47
Risk/Reward Ratio: 2.22
Ready to trade our analysis of Costco? Here is our list of the best stockbrokers worth reviewing.