
Top Regulated Brokers
Short Trade Idea
Enter your short position between $113.97 (Friday’s intra-day low) and $119.36 (Friday’s intra-day high).
Market Index Analysis
Cisco Systems (NASDAQ:CSCO) is a member of the NASDAQ 100 Index, the Dow Jones Industrial Average Index, the S&P 100 Index, and the S&P 500 Index.
All four indices trade near all-time highs, resembling bubble conditions in France during the Mississippi Bubble that burst in 1720.
The Bull Bear Power Indicator for the NASDAQ 100 Index is bullish with a negative divergence.
Market Sentiment Analysis
Equity futures point to a continuation of Friday’s sell-off as oil prices climb following US President Trump’s renewed threat against Iran if they fail to reach a deal quickly. The latest inflation data showed price pressures outside the energy sector, with core prices accelerating, increasing bets on an interest rate hike rather than a cut this year, and stoking more stagflation concerns. Earnings from NVIDIA, Walmart, and Target highlight this week’s earnings releases.
Cisco Systems Fundamental Analysis
Cisco Systems is a technology company known for its networking, security, software, and cloud computing solutions. It has also faced allegations of collaborating with the NSA’s Tailored Access Operations (TAO) unit to intercept network gear.
So, why am I bearish on CSCO despite its post-earnings spike?
Cisco beat revenue and earnings per share expectations of $15.56 billion and $1.04, reporting $15.84 billion and $1.06, respectively. Still, I remain bearish amid cash flow concerns that have fallen below levels before its $28 billion all-cash acquisition of Splunk in March 2024. Other bearish catalysts include Splunk’s revenue drag from its transition to the cloud, shrinking margins, and market share losses to NVIDIA and Arista Networks.
Metric | Value | Verdict |
P/E Ratio | 39.40 | Bearish |
P/B Ratio | 7.99 | Bearish |
PEG Ratio | 1.49 | Bullish |
Current Ratio | 0.93 | Bearish |
ROIC-WACC Ratio | Positive | Bullish |
Cisco Systems Fundamental Analysis Snapshot
The price-to-earnings (P/E) ratio of 39.40 makes CSCO an expensive stock. By comparison, the P/E ratio for the NASDAQ 100 Index is 38.60.
The average analyst price target for CSCO is $119.78. This suggests negligible upside potential, with massive downside risks.
Cisco Systems Technical Analysis
Today’s CSCO Signal
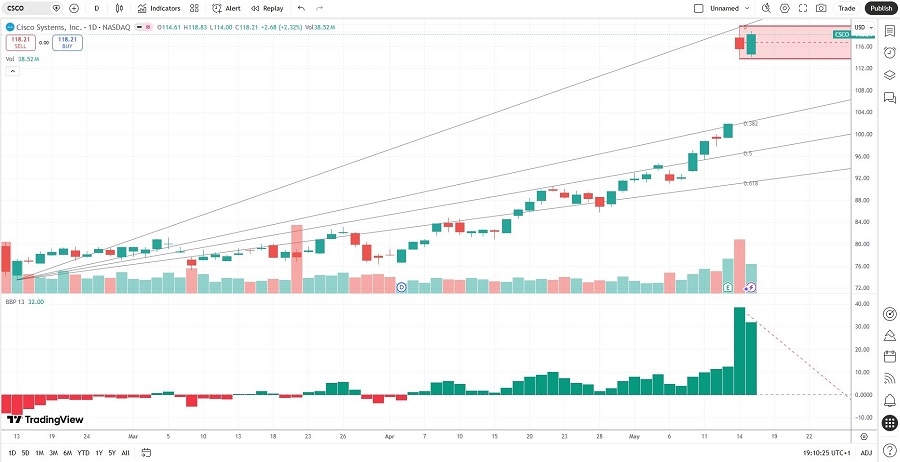
Cisco Systems Price Chart
The CSCO D1 chart shows price action potentially forming a new horizontal resistance zone.
It also shows price action between its ascending 0.0% and 50.0% Fibonacci Retracement Fan levels.
The Bull Bear Power Indicator spiked into unsustainable bullish territory with a descending trendline.
The average bearish trading volumes are higher than the average bullish trading volumes.
CSCO rallied with the NASDAQ 100 Index, a bullish signal, but breakdown catalysts are accumulating.
My CSCO Short Stock Trade
CSCO Entry Level: Between $113.97 and $119.36
CSCO Take Profit: Between $85.78 and $90.45
CSCO Stop Loss: Between $125.33 and $129.09
Risk/Reward Ratio: 2.48
Ready to trade our analysis of CSCO? Here is our list of the best stockbrokers worth reviewing.