


Short Trade Idea
Enter your short position between $483.21 (yesterday’s intra-day low) and $487.78 (yesterday’s intra-day high).
Market Index Analysis
Berkshire Hathaway (NYSE:BRK.B) is a member of the S&P 100 Index and the S&P 500 Index.
Both indices recorded fresh all-time highs on bearish trading volumes, driven solely by AI-related companies, as the rest of the market underperforms.
The Bull Bear Power Indicator for the S&P 500 Index is bullish with a negative divergence.
Market Sentiment Analysis
Equity futures are wavering this morning but are mostly higher after Micron and SK Hynix topped $1 trillion in market cap for the first time, driven by the AI mania, which has pushed indices to record highs, a trend that could extend but slow its trajectory over the summer. Marvell Technology, Salesforce, Snowflake, and Abercrombie & Fitch will report earnings today, which could inject volatility.
Top Regulated Brokers
Berkshire Hathaway Fundamental Analysis
Berkshire Hathaway is a multinational conglomerate holding company that many see as an investment fund. In the ten years ending in 2023, Berkshire Hathaway produced a compound annual growth rate of 11.8% versus 12.0% for the S&P 500.
So, why am I bearish on BRK.B at current levels?
Berkshire Hathaway lost its most substantial asset after Warren Buffett handed the reins to Greg Abel, as evidenced by BRK.B’s 36% underperformance relative to the S&P 500. The lack of a designated successor for the critical investment portfolio management role suggests a less active Berkshire Hathaway moving forward, despite its massive cash pile nearing $400 billion. Its second-largest asset, GEICO, also struggles, while Berkshire's investment style is structurally misaligned with the AI-driven market momentum, amplifying medium-term bearish pressures.
Metric | Value | Verdict |
P/E Ratio | 14.39 | Bullish |
P/B Ratio | 1.44 | Bullish |
PEG Ratio | Unavailable | Bearish |
Current Ratio | 2.88 | Bullish |
ROIC-WACC Ratio | Positive | Bullish |
Berkshire Hathaway Fundamental Analysis Snapshot
The price-to-earning (P/E) ratio of 14.39 makes BRK.B an inexpensive stock. By comparison, the P/E ratio for the S&P 500 Index is 32.41.
The average analyst price target for BRK.B is $520.33. This suggests moderate upside potential, but downside risks are notably greater.
Berkshire Hathaway Technical Analysis
Today’s BRK.B Signal
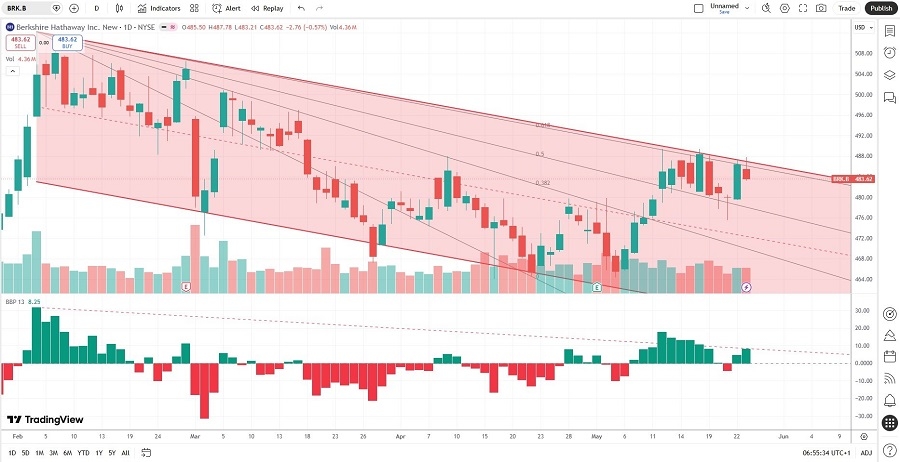
Berkshire Hathaway Price Chart
The BRK.B D1 chart shows price action in a bearish price channel.
It also shows price action between its descending 50.0% and 61.8% Fibonacci Retracement Fan levels.
The Bull Bear Power Indicator is bullish with a descending trendline.
The average bearish trading volumes are higher than the average bullish trading volumes.
BRK.B was moving lower as the S&P 500 Index advanced, a significant bearish confirmation.
My BRK.B Short Stock Trade
BRK.B Entry Level: Between $483.21 and $487.78
BRK.B Take Profit: Between $433.17 and $440.10
BRK.B Stop Loss: Between $506.52 and $512.13
Risk/Reward Ratio: 2.15
Ready to trade our analysis of Berkshire Hathaway? Here is our list of the best stockbrokers worth reviewing.