
Short Trade Idea
Enter your short position between $278.37 (Friday’s intra-day low) and $283.42 (an intermediate horizontal resistance level).
Market Index Analysis
Apple (NASDAQ:AAPL) is a member of the NASDAQ 100 Index, the Dow Jones Industrial Average Index, the S&P 100 Index, and the S&P 500 Index.
All four indices are climbing a wall of worry and ignoring medium-term issues that accumulate.
The Bull Bear Power Indicator for the NASDAQ 100 Index is bullish with a negative divergence.
Market Sentiment Analysis
Equity futures hover near record highs as the US and Iran are moving closer to a peace deal. Meme stock GameStop made a bold acquisition offer for e-commerce retailer eBay, trying to compete with Amazon at a $56 billion price tag, a move that had been rumored for weeks. Lattice Semiconductor Corporation, Advanced Micro Devices, Arm Holdings, Palantir, and Paramount Skydance highlight this week’s earnings reports.
Apple Fundamental Analysis
Apple is the largest tech company by revenue and the third-largest company by market capitalization. It is at the core of the US tech industry, but it is missing out on several disruptive trends. Still, it has high brand loyalty and a massive following.
So, why am I bearish on AAPL despite its earnings beat?
Apple narrowly beat revenue and earnings per share expectations of $109.46 billion and $1.95 by reporting $111.18 billion and $2.01, respectively. Still, I remain bearish amid risks of stagnating demand and rising supply chain competition, which could drive up component costs. I am also skeptical about Apple Intelligence’s monetization, and the delayed overhaul of Siri adds to near-term concerns alongside antitrust risks.
Metric | Value | Verdict |
P/E Ratio | 33.93 | Bearish |
P/B Ratio | 38.59 | Bearish |
PEG Ratio | 2.52 | Bearish |
Current Ratio | 1.07 | Bearish |
ROIC-WACC Ratio | Positive | Bullish |
Apple Fundamental Analysis Snapshot
The price-to-earnings (P/E) ratio of 33.93 indicates that AAPL is fairly valued. By comparison, the P/E ratio for the NASDAQ 100 Index is 36.16.
The average analyst price target for AAPL is $300.65. This suggests limited upside potential, while downside risks remain dominant.
Apple Technical Analysis
Today’s AAPL Signal
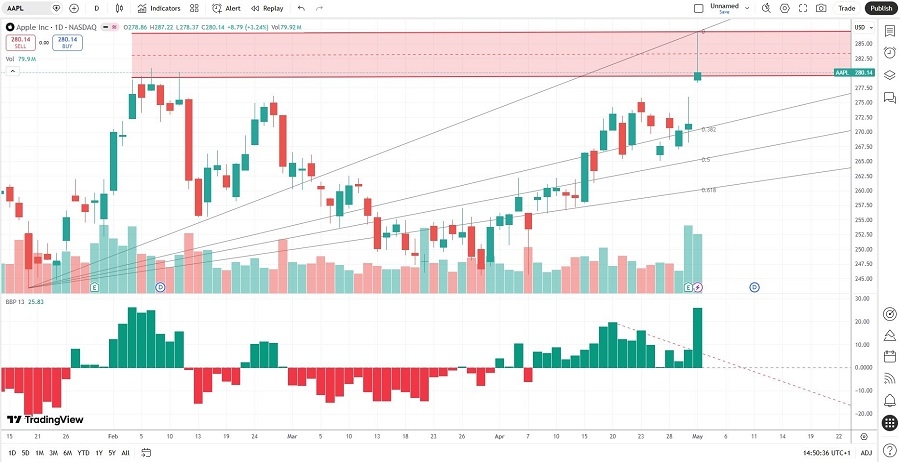
Apple Price Chart
The AAPL D1 chart shows price action breaking down below its horizontal resistance zone.
It also shows price action between its ascending 0.0% and 38.2% Fibonacci Retracement Fan levels.
The Bull Bear Power Indicator spiked into unsustainable bullish conditions above its descending trendline.
The average bullish trading volumes are higher than the average bearish trading volumes, hinting at more potential for short-term volatility.
AAPL rallied with the NASDAQ 100 Index, a bullish confirmation, but bearish factors are rising.
My AAPL Short Stock Trade
AAPL Entry Level: Between $278.37 and $283.42
AAPL Take Profit: Between $245.51 and $252.18
AAPL Stop Loss: Between $291.63 and $300.65
Risk/Reward Ratio: 2.48
Ready to trade our analysis of Apple? Here is our list of the best stockbrokers worth checking out.