
Top Regulated Brokers
Short Trade Idea
Enter your short position between $329.80 (yesterday’s intra-day low) and $338.49 (yesterday’s intra-day high).
Market Index Analysis
Amgen (NASDAQ:AMGN) is a member of the NASDAQ 100 Index, the Dow Jones Industrial Average Index, the S&P 100 Index, and the S&P 500 Index.
All four indices retreated from all-time highs amid rising inflation and decreasing wages but remain excessively high and disconnected from economic reality.
The Bull Bear Power Indicator for the NASDAQ 100 Index is bullish with a negative divergence.
Market Sentiment Analysis
Equity futures are moderately recovering following yesterday’s mostly bearish sessions after April’s CPI report came in higher than expected at 3.8% annually, while real average hourly wages decreased 0.5% monthly and 0.3% annually. US President Trump will travel to China to meet President Xi, while Kevin Warsh received his Senate approval, and Cisco Systems and Alibaba Group earnings are likely to overshadow April’s PPI report.
Amgen Fundamental Analysis
Amgen is the 18th largest biomedical company by revenue, a Fortune 500 company, and has 17 clinical programs in Phase III, 8 in Phase II, and 19 in Phase I.
So, why am I bearish on AMGN despite better-than-expected earnings?
Amgen reported revenues of $8.62 billion with earnings per share of $5.15, ahead of expectations of $8.58 billion and $4.77, respectively. Still, I remain bearish amid regulatory scrutiny of Tavneos following the FDA's new warning about liver risks. Patent cliffs for Enbrel, Prolia, Xgeva, and Otezla are also approaching. The timeline for its obesity drug candidate MariTide remains uncertain, and revenue contraction for Repatha and Otezla amid competition adds to medium-term concerns.
Metric | Value | Verdict |
P/E Ratio | 23.42 | Bullish |
P/B Ratio | 19.49 | Bearish |
PEG Ratio | 2.19 | Bearish |
Current Ratio | 1.26 | Bearish |
ROIC-WACC Ratio | Positive | Bullish |
Amgen Fundamental Analysis Snapshot
The price-to-earning (P/E) ratio of 23.42 makes AMGN an inexpensive stock. By comparison, the P/E ratio for the NASDAQ 100 Index is 38.57.
The average analyst price target for AMGN is $353.07. This suggests negligible upside potential, while downside risks remain elevated.
Amgen Technical Analysis
Today’s AMGN Signal
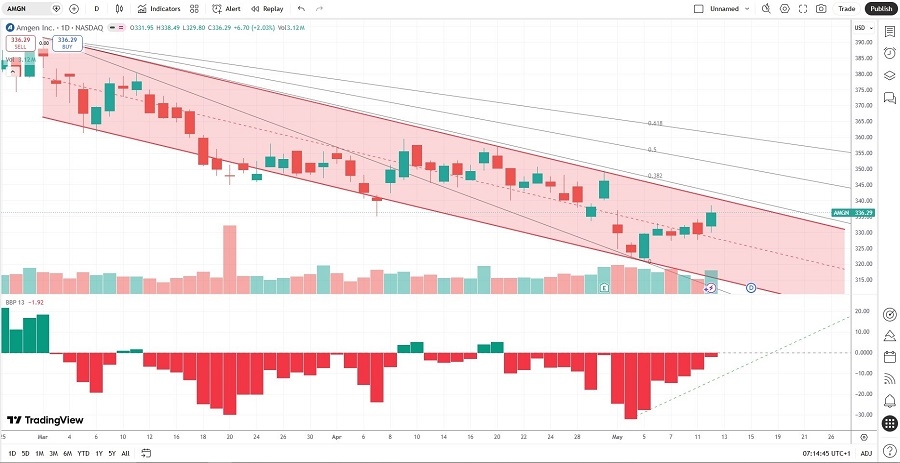
Amgen Price Chart
The AMGN D1 chart shows price action inside a bearish price channel.
It also shows price action between its descending 0.0% and 38.2% Fibonacci Retracement Fan levels.
The Bull Bear Power Indicator is bearish with an ascending trendline, suggesting more short-term volatility potential.
The average bearish trading volumes are higher than the average bullish trading volumes.
AMGN corrected as the NASDAQ 100 Index rallied, a significant bearish trading signal.
My AMGN Short Stock Trade
AMGN Entry Level: Between $329.80 and $338.49
AMGN Take Profit: Between $269.77 and $275.16
AMGN Stop Loss: Between $356.90 and $368.78
Risk/Reward Ratio: 2.22
Ready to trade our analysis of Amgen? Here is our list of the best stockbrokers worth reviewing.