
Short Trade Idea
Enter your short position between $415.48 (an intermediate horizontal support level) and $421.47 (yesterday’s open).
Market Index Analysis
Advanced Micro Devices (NASDAQ:AMD) is a member of the NASDAQ 100 Index, the S&P 100 Index, and the S&P 500 Index.
All three indices record all-time highs despite worsening macroeconomic issues.
The Bull Bear Power Indicator for the NASDAQ 100 Index is bullish with a negative divergence.
Market Sentiment Analysis
Equity futures are moving higher and extending their record run amid optimism over tech earnings, but ARM Holdings sent jitters through markets amid chip supply concerns, while monitoring progress in the US-Iran peace process and ignoring macroeconomic issues from higher-for-longer oil prices, troubling consumer credit developments with auto loans the latest flashpoint, and market stability risks from private credit. Earnings from McDonald’s, Shake Shack, and Papa John’s will offer more consumer spending insights today.
Advanced Micro Devices Fundamental Analysis
Advanced Micro Devices is an industry-leading chip manufacturer at the forefront of the global AI race. It is also a core player in the gaming sector, where its hardware is among the best for high-end users, and a significant provider of server hardware to data centers.
So, why am I bearish on AMD despite its massive post-earnings rally?
While Advanced Micro Devices reported revenues of $10.25 billion and earnings per share of $1.37, beating expectations of $9.90 billion and $1.29, respectively, and issuing upbeat guidance, I turned bearish as the good news is priced into the shares. Valuations are excessive, analyst downgrades and skepticism are rising, and I am also bearish on its TSMC dependency. The expected 20% decline in gaming and PC demand is another bearish catalyst, as competition for data center chips is heating up.
MAMDic | Value | Verdict |
P/E Ratio | 140.93 | Bearish |
P/B Ratio | 9.19 | Bearish |
PEG Ratio | 1.05 | Bullish |
Current Ratio | 2.85 | Bullish |
ROIC-WACC Ratio | Negative | Bearish |
Advanced Micro Devices Fundamental Analysis Snapshot
The price-to-earning (P/E) ratio of 140.93 makes AMD an expensive stock. In comparison, the P/E ratio for the NASDAQ 100 Index is 37.32.
The average analyst price target for AMD is $312.28. This suggests no upside potential with massive downside risks.
Advanced Micro Devices Technical Analysis
Today’s AMD Signal
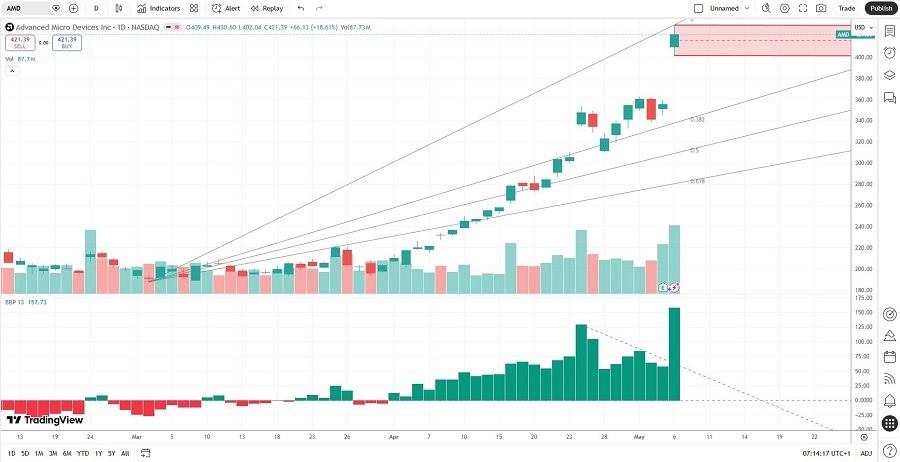
Advanced Micro Devices Price Chart
The AMD D1 chart shows price action potentially forming a new horizontal resistance zone.
It also shows price action between its ascending 0.0% and 38.2% Fibonacci Retracement Fan levels.
The Bull Bear Power Indicator spiked into unsustainable bullish territory above its descending trendline.
The average bullish trading volumes are higher than the average bearish trading volumes, suggesting more short-term volatility potential.
AMD accelerated more than the NASDAQ 100 Index, a bullish confirmation, but bearish catalysts are accumulating.
My AMD Short Stock Trade
AMD Entry Level: Between $415.48 and $421.47
AMD Take Profit: Between $310.00 and $318.86
AMD Stop Loss: Between $452.13 and $461.17
Risk/Reward Ratio: 2.88
Ready to trade our analysis of AMD? Here is our list of the best stockbrokers worth checking out.