
Top Regulated Brokers
Short Trade Idea
Enter your short position between $70.61 (an intermediate horizontal support level) and $71.69 (the intra-day low of its last bullish candlestick).
Market Index Analysis
Alliant Energy (NASDAQ:LNT) is a member of the S&P 500 Index.
This index trades near all-time highs, resembling bubble conditions in France during the Mississippi Bubble that burst in 1720.
The Bull Bear Power Indicator for the S&P 500 Index is bullish with a negative divergence.
Market Sentiment Analysis
Equity futures point to a continuation of Friday’s sell-off as oil prices climb following US President Trump’s renewed threat against Iran if they fail to reach a deal quickly. The latest inflation data showed price pressures outside the energy sector, with core prices accelerating, increasing bets on an interest rate hike rather than a cut this year, and stoking more stagflation concerns. Earnings from NVIDIA, Walmart, and Target highlight this week’s earnings releases.
Alliant Energy Fundamental Analysis
Alliant Energy is a utility company. Its subsidiaries include Interstate Power and Light Company, Wisconsin Power and Light Company, and Travero. It provides services to Iowa and Wisconsin.
So, why am I bearish on LNT following its post-earnings breakdown?
Alliant Energy reported revenues of $1.18 billion and earnings per share of $0.82, ahead of expectations calling for $1.08 billion and $0.79, respectively. I remain bearish amid ongoing institutional outflows, while short interest spiked from 4.7% to 8.5% of the float. Debt levels are high, financing costs remain elevated and eat into free cash flow, while regulatory risks and reliance on coal add to bearish catalysts.
Metric | Value | Verdict |
P/E Ratio | 22.30 | Bearish |
P/B Ratio | 2.50 | Bearish |
PEG Ratio | 2.48 | Bearish |
Current Ratio | 0.69 | Bearish |
ROIC-WACC Ratio | Negative | Bearish |
Alliant Energy Fundamental Analysis Snapshot
The price-to-earning (P/E) ratio of 22.30 indicates that LNT is expensive relative to its industry. By comparison, the P/E ratio for the S&P 500 Index is 31.90.
The average analyst price target for LNT is $78.96. This suggests moderate upside potential with above-average downside risks.
Alliant Energy Technical Analysis
Today’s LNT Signal
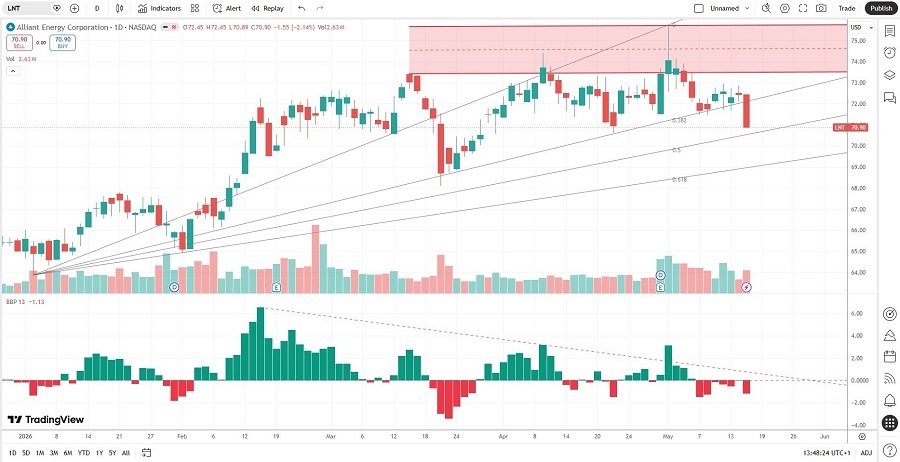
Alliant Energy Price Chart
The LNT D1 chart shows price action below its horizontal resistance zone following a breakdown.
It also shows price action between its ascending 38.2% and 50.0% Fibonacci Retracement Fan levels.
The Bull Bear Power Indicator is bearish with a descending trendline.
The average bearish trading volumes are higher than the average bullish trading volumes.
LNT corrected as the S&P 500 Index moved higher, a significant bearish trading signal.
My LNT Short Stock Trade
LNT Entry Level: Between $70.61 and $71.69
LNT Take Profit: Between $58.20 and $60.84
LNT Stop Loss: Between $75.76 and $78.96
Risk/Reward Ratio: 2.41
Ready to trade our analysis of LNT? Here is our list of the best stockbrokers worth reviewing.