
Long Trade Idea
Enter your long position between $206.74 (yesterday’s intra-day low) and $211.23 (yesterday’s intra-day high).
Market Index Analysis
Automated Data Processing (NASDAQ:ADP) is a member of the NASDAQ 100 Index and the S&P 500 Index.
Both indices record all-time highs amid a backdrop of rising bearish factors.
The Bull Bear Power Indicator for the NASDAQ 100 Index is bullish with a negative divergence.
Market Sentiment Analysis
Equity futures are advancing following another tech-fueled rally, getting another boost as President Trump suspends the American operation to reopen the Strait of Hormuz. AMD and SMCI surged by double-digit percentages in after-hours trading after reporting earnings. Today’s ADP data will offer a snapshot of the labor market before Friday’s NFP report. Novo Nordisk, The Walt Disney Company, and Uber highlight today’s earnings.
Automated Data Processing Fundamental Analysis
Automated Data Processing is a human resources and management firm with an expanding global footprint. It is best known for its ADP employment report in the US, which precedes the official NFP report by two days.
So, why am I bullish on ADP following its post-earnings breakout?
Automated Data Processing reported revenues of $5.94 billion with earnings per share of $3.37, beating expectations of $5.85 billion and $3.30, respectively, despite a challenging backdrop. I remain bullish on ADP amid AI-driven productivity gains through its AI-enabled human capital management (HCM) tools. It also raised its full-year outlook, and valuations confirm that it is undervalued. Demand for compliance-driven HR solutions adds another bullish catalyst.
Metric | Value | Verdict |
P/E Ratio | 19.65 | Bullish |
P/B Ratio | 13.30 | Bearish |
PEG Ratio | 2.49 | Bearish |
Current Ratio | 1.04 | Bearish |
ROIC-WACC Ratio | Negative | Bearish |
Automated Data Processing Fundamental Analysis Snapshot
The price-to-earning (P/E) ratio of 19.65 makes ADP an inexpensive stock. By comparison, the P/E ratio for the NASDAQ 100 Index is 36.62.
The average analyst price target for ADP is $246.73. This suggests good upside potential with reasonable downside risk.
Automated Data Processing Technical Analysis
Today’s ADP Signal
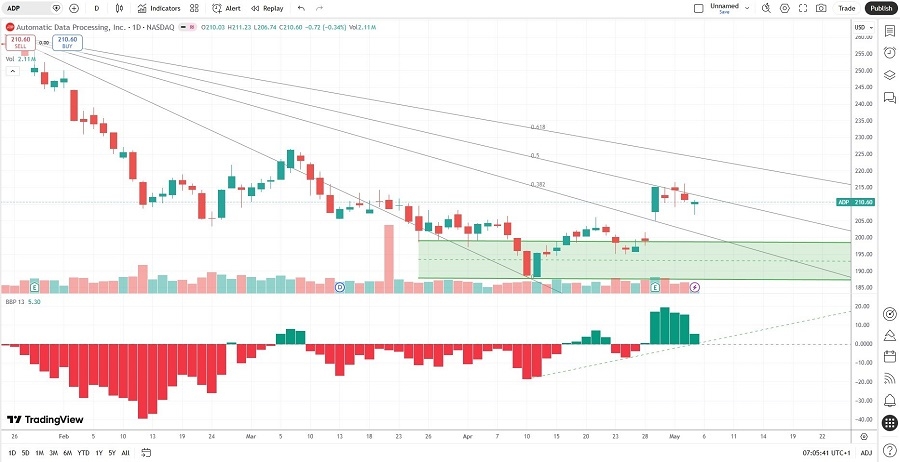
Automated Data Processing Price Chart
The ADP D1 chart shows price action breaking out above its horizontal support zone.
It also shows price action between its descending 38.2% and 50.0% Fibonacci Retracement Fan levels.
The Bull Bear Power Indicator is bullish and above its ascending trendline.
The average bearish trading volumes are higher than the average bullish trading volumes, hinting at more short-term volatility potential.
ADP rallied with the NASDAQ 100 Index, a bullish confirmation.
My ADP Long Stock Trade
ADP Entry Level: Between $206.74 and $211.23
ADP Take Profit: Between $255.73 and $260.65
ADP Stop Loss: Between $184.85 and $188.79
Risk/Reward Ratio: 2.24
Ready to trade our analysis of ADP? Here is our list of the best stockbrokers worth reviewing.