
Short Trade Idea
Enter your short position between $204.87 (yesterday’s intra-day low) and $208.34 (yesterday’s intra-day high).
Market Index Analysis
AbbVie (NYSE:ABBV) is a member of the S&P 100 Index and the S&P 500 Index.
Both indices remain near records despite mounting bearish developments.
The Bull Bear Power Indicator for the S&P 500 Index is bullish with a negative divergence.
Market Sentiment Analysis
Equity futures are drifting moderately higher following yesterday’s sell-off as tensions between the US and Iran flared as fire was exchanged in the Strait of Hormuz, while the UAE and Iran confirmed that Iran launched an attack against the former OPEC member. Oil prices remain above $100 per barrel, but markets are dismissing the long-term negative impact of higher input costs. On the earnings front, Shopify, Pfizer, and Advanced Micro Devices highlight today’s releases.
AbbVie Fundamental Analysis
AbbVie is a pharmaceutical company ranked seventh among the largest by revenue, with a growing neuroscience presence bolstered by a robust product portfolio.
So, why am I bearish on ABBV despite its earnings beat?
AbbVie reported revenues of $15.00 billion, ahead of estimates calling for revenues of $14.72 billion, while earnings per share of $2.65 beat estimates of $2.59. I remain bearish as I see no medium-term revenue replacement for the loss of Humira patent protection, while the transition to new drugs remains slow. ABBV also faces intensifying competition in immunology for its blockbuster drugs Skyrizi and Rinvoq, threatening market share and further reducing future revenues. Valuations are three times higher than those of many leading AI companies, while the negative shareholder equity is a huge red flag.
Metric | Value | Verdict |
P/E Ratio | 101.05 | Bearish |
P/B Ratio | 245.29 | Bearish |
PEG Ratio | 0.57 | Bullish |
Current Ratio | Unavailable | Bearish |
ROIC-WACC Ratio | Positive | Bullish |
AbbVie Fundamental Analysis Snapshot
The price-to-earning (P/E) ratio of 101.05 makes ABBV an expensive stock. By comparison, the P/E ratio for the S&P 500 Index is 30.96.
The average analyst price target for ABBV is $250.33. This suggests moderate upside potential with higher downside risks.
AbbVie Technical Analysis
Today’s ABBV Signal
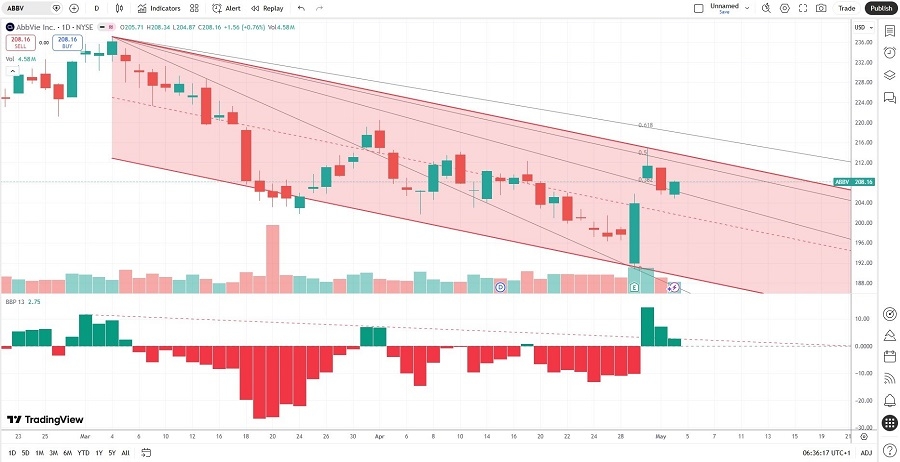
AbbVie Price Chart
The ABBV D1 chart shows price action inside a bearish price channel.
It also shows price action between its descending 38.2% and 50.0% Fibonacci Retracement Fan levels.
The Bull Bear Power Indicator is bullish with a descending trendline, approaching a bearish crossover.
The average bearish trading volumes are higher than the average bullish trading volumes.
ABBV corrected as the S&P 500 Index advanced, a bearish confirmation.
My ABBV Short Stock Trade
ABBV Entry Level: Between $204.87 and $208.34
ABBV Take Profit: Between $153.68 and $160.00
ABBV Stop Loss: Between $228.62 and $237.11
Risk/Reward Ratio: 2.16
Ready to trade our analysis of AbbVie? Here is our list of the best stockbrokers worth reviewing.