
Short Trade Idea
Enter your short position between $78.69 (Thursday’s intra-day low) and $80.84 (Thursday’s intra-day high).
Market Index Analysis
Wells Fargo (NYSE:WFC) is a member of the S&P 100 Index and the S&P 500 Index.
Both indices correct within a bearish price channel with fading depressed bullish factors.
The Bull Bear Power Indicator for the S&P 500 Index turned bearish with a descending trendline.
Market Sentiment Analysis
Equity futures are moving lower as oil futures spike after US President Trump renewed his vow to destroy Iran unless they open the Strait of Hormuz by Tuesday. Markets await Thursday’s CPI and Friday’s PCE reports, which will offer clues on how the oil price surge has impacted inflationary pressures, but the true impact will take more time to work through the economy. Earnings from Delta, Levi Strauss, and Constellation Brands are also due this week, while a Trump administrator hinted at broad tariff refunds.
Wells Fargo Fundamental Analysis
Wells Fargo is a banking conglomerate serving over 70 million customers in more than 35 countries. It is one of the Big Four Banks in the US and remains classified as a systemically important financial institution by the Financial Stability Board.
So, why am I bearish on WFC despite attractive valuations?
Wells Fargo’s reputation continues to suffer from ongoing legal issues, while heightened regulatory scrutiny diminishes its operational flexibility. I remain bearish amid macroeconomic pressures and their impact on consumer confidence and corporate lending. I am equally bearish on its risk profile following a $1.3 billion collateral shortfall related to a failed UK mortgage firm and the emergence of net interest income pressure.
Metric | Value | Verdict |
P/E Ratio | 12.88 | Bullish |
P/B Ratio | 1.51 | Bullish |
PEG Ratio | 1.72 | Bullish |
Current Ratio | Unavailable | Bearish |
ROIC-WACC Ratio | Negative | Bearish |
Wells Fargo Fundamental Analysis Snapshot
The price-to-earnings (P/E) ratio of 12.88 makes WFC an inexpensive stock. By comparison, the P/E ratio for the S&P 500 Index is 23.70.
The average analyst price target for WFC is $99.02. It suggests good upside potential, but downside risks are high.
Wells Fargo Technical Analysis
Today’s WFC Signal
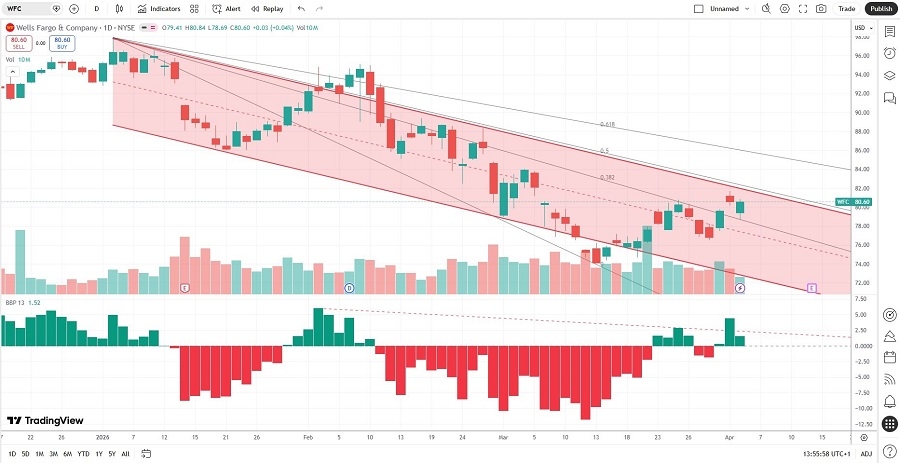
Wells Fargo Price Chart
The WFC D1 chart shows price action inside a bearish price channel.
It also shows price action between its descending 38.2% and 50.0% Fibonacci Retracement Fan levels.
The Bull Bear Power Indicator is bullish but remains below its descending trendline.
The average bullish trading volumes are higher than the average bearish trading volumes, hinting at more short-term volatility.
WFC corrected more than the S&P 500 Index, a significant bearish confirmation.
My WFC Short Stock Trade
WFC Entry Level: Between $78.69 and $80.84
WFC Take Profit: Between $58.42 and $60.88
WFC Stop Loss: Between $88.32 and $90.91
Risk/Reward Ratio: 2.11
Ready to trade our analysis of Wells Fargo? Here is our list of the best stock brokers worth checking out.