
Long Trade Idea
Enter your Long position between $46.38 (an intermediate horizontal support level) and $48.65 (yesterday’s intra-day high).
Market Index Analysis
Verizon Communications (NYSE:VZ) is a member of the Dow Jones Industrial Average Index, the S&P 100 Index, and the S&P 500 Index.
All three indices continue to record fresh all-time highs amid lower trading volumes.
The Bull Bear Power Indicator for the S&P 500 Index is bullish with a negative divergence.
Market Sentiment Analysis
Equity futures are mixed after the record-setting rally in the S&P 500 Index and the NASDAQ 100 Index continues despite mounting concerns, once again driven by AI-related developments. OpenAI’s revenue miss served as the latest warning. US President Trump discussed Iran’s peace proposal with top aides but has not yet announced a decision. Earnings season will continue to offer catalysts.
Verizon Communications Fundamental Analysis
Verizon Communications is the largest mobile carrier in the US and the second-largest global telecommunications company based on revenue. It employs nearly 100,000 people and serves over 146 million customers.
So, why am I bullish on VZ following its mixed earnings release?
Verizon Communications missed revenue expectations of $34.82 billion, reporting $34.40 billion, but its earnings per share of $1.28 beat estimates of $1.21, while Verizon raised its full-year guidance. I turned bullish amid encouraging broadband and fiber growth after VZ added 127,000 fiber net adds and 214,000 fixed wireless access (FWA) connections. I am also bullish on the Frontier integration and related cost savings. Verizon reported its first positive Q1 postpaid phone net adds (55,000) since 2013, adding a bullish catalyst.
Metric | Value | Verdict |
P/E Ratio | 11.49 | Bullish |
P/B Ratio | 1.90 | Bullish |
PEG Ratio | 1.16 | Bullish |
Current Ratio | 0.91 | Bearish |
ROIC-WACC Ratio | Positive | Bullish |
Verizon Communications Fundamental Analysis Snapshot
The price-to-earnings (P/E) ratio of 11.49 makes VZ an inexpensive stock. By comparison, the P/E ratio for the S&P 500 is 25.79.
The average analyst price target for VZ is $51.58. This suggests moderate upside potential with fading downside risks.
Verizon Communications Technical Analysis
Today’s VZ Signal
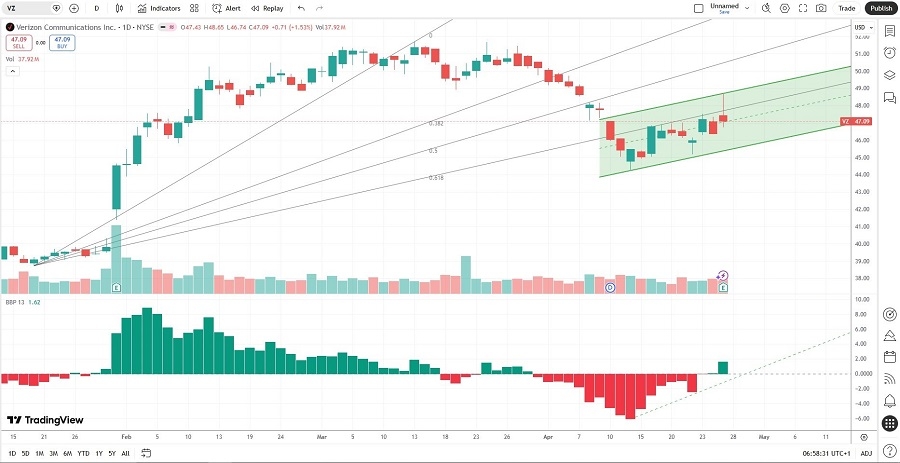
Verizon Communications Price Chart
The VZ D1 chart shows price action inside a bullish price channel.
It also shows price action attempting to break into its ascending Fibonacci Retracement Fan.
The Bull Bear Power Indicator turned bullish with an ascending trendline.
The average bearish trading volumes are higher than the average bullish trading volumes, suggesting more short-term volatility potential.
VZ advanced with the S&P 500, a bullish confirmation.
My VZ Long Stock Trade
VZ Entry Level: Between $46.38 and $48.65
VZ Take Profit: Between $59.12 and $60.90
VZ Stop Loss: Between $40.30 and $41.38
Risk/Reward Ratio: 2.10
Ready to trade our analysis of Verizon? Here is our list of the best stockbrokers worth reviewing.