
Short Trade Idea
Enter your short position between $43.35 (the intra-day low of its last bearish candlestick) and $45.45 (yesterday’s intra-day high).
Market Index Analysis
Tractor Supply (NASDAQ:TSCO) is a member of the S&P 500 Index.
This index is pushing higher from its 2026 lows, but bullish trading volumes remain low.
The Bull Bear Power Indicator for the S&P 500 Index turned bullish with an ascending trendline.
Market Sentiment Analysis
Equity futures are moving lower as oil extends its advance amid uncertainty about what US President Trump will do once his Tuesday deadline for Iran to reopen the Strait of Hormuz passes. He vowed to bomb Iran’s power plants and infrastructure today, as negotiations for a cease-fire and potential end to the war resume. President Trump backed away from seizing Iran’s oil amid domestic pressures to end the war. On the economic front, preliminary durable goods orders for February will be released this morning.
Tractor Supply Fundamental Analysis
Tractor Supply is an agriculture, lawn and garden maintenance, livestock, equine, and pet retailer with over 2,200 stores and expansion plans to reach 3,000 store locations. It is also a Fortune 500 company.
So, why am I bearish on TSCO at current levels?
Tractor Supply suffers from sluggish sales growth, as evidenced by last quarter’s net sales increase of 3.3% year-over-year and comparable same-store sales rising just 0.3%. I expect weak consumer spending on discretionary items to persist amid macroeconomic issues and elevated inflationary pressures. Margin pressures are another bearish catalyst, stemming from lower-margin product sales and declines in big-ticket purchases. Despite its recent correction, valuations remain elevated, adding to my bearish outlook.
Metric | Value | Verdict |
P/E Ratio | 22.03 | Bearish |
P/B Ratio | 9.25 | Bearish |
PEG Ratio | 1.83 | Bullish |
Current Ratio | 1.34 | Bearish |
ROIC-WACC Ratio | Positive | Bullish |
Tractor Supply Fundamental Analysis Snapshot
The price-to-earnings (P/E) ratio of 22.03 indicates that TSCO is fairly valued. By comparison, the P/E ratio for the S&P 500 Index is 23.77.
The average analyst price target for TSCO is $57.59. It suggests excellent upside potential, though downside risks dominate.
Tractor Supply Technical Analysis
Today’s TSCO Signal
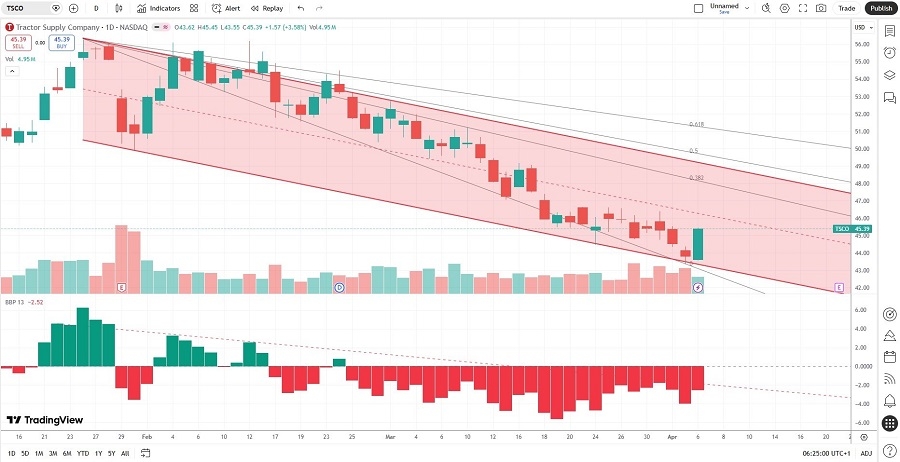
Tractor Supply Price Chart
The TSCO D1 chart shows price action inside a bearish price channel.
It also shows price action between its descending 0.0% and 38.2% Fibonacci Retracement Fan levels.
The Bull Bear Power Indicator is bearish and below its descending trendline.
The average bearish trading volumes are higher than the average bullish trading volumes.
TSCO corrected more than the S&P 500 Index, a bearish confirmation.
My TSCO Short Stock Trade
TSCO Entry Level: Between $43.35 and $45.45
TSCO Take Profit: Between $29.69 and $31.41
TSCO Stop Loss: Between $49.92 and $51.21
Risk/Reward Ratio: 2.08
Ready to trade our analysis of Tractor Supply? Here is our list of the best stock brokers worth checking out.