
Short Trade Idea
Enter your short position between $67.51 (the intra-day low of its last bullish candlestick) and $69.25 (yesterday’s intra-day high).
Market Index Analysis
The Kroger Company (NYSE:KR) is a member of the S&P 500 Index.
This index remains near record highs with bearish trading volumes.
The Bull Bear Power Indicator for the S&P 500 Index is bullish with a negative divergence.
Market Sentiment Analysis
Equity futures are bearish this morning as oil prices are climbing amid stalled peace talks between the US and Iran. Still, markets have moved on from the war, assuming the worst is behind the economy, which could be a gross miscalculation regarding the persistent inflationary impact of high oil prices. Tesla, ServiceNow, and IBM fell after beating earnings, while American Express, Blackstone, and American Airlines are among today’s earnings.
The Kroger Company Fundamental Analysis
The Kroger Company is the largest US supermarket operator by revenue, the fifth-largest retailer, and one of the largest American-owned private employers. It operates over 2,700 stores across 35 states, including pharmacies, 220+ The Little Clinic in-store medical clinics, and 33 manufacturing plants.
So, why am I bearish on KR at current levels?
I turned bearish on Kroger amid margin pressures stemming from its inability to pass on price increases to consumers. Aggressive competition from Amazon, Walmart, and Albertsons adds to challenges to its top-line growth sustainability. The leadership transition uncertainty around CEO Greg Foran, as KR focuses on store expansion and digital transformation plans, adds to medium-term concerns. High debt and the legal overhang of its terminated Albertsons merger are additional bearish factors.
Metric | Value | Verdict |
P/E Ratio | 44.20 | Bearish |
P/B Ratio | 7.11 | Bearish |
PEG Ratio | 1.62 | Bullish |
Current Ratio | 0.80 | Bearish |
ROIC-WACC Ratio | Positive | Bullish |
The Kroger Company Fundamental Analysis Snapshot
The price-to-earnings (P/E) ratio of 44.20 makes KR an expensive stock. By comparison, the P/E ratio for the S&P 500 Index is 25.61.
The average analyst price target for KR is $75.45. This suggests moderate upside potential with elevated downside risks.
The Kroger Company Technical Analysis
Today’s KR Signal
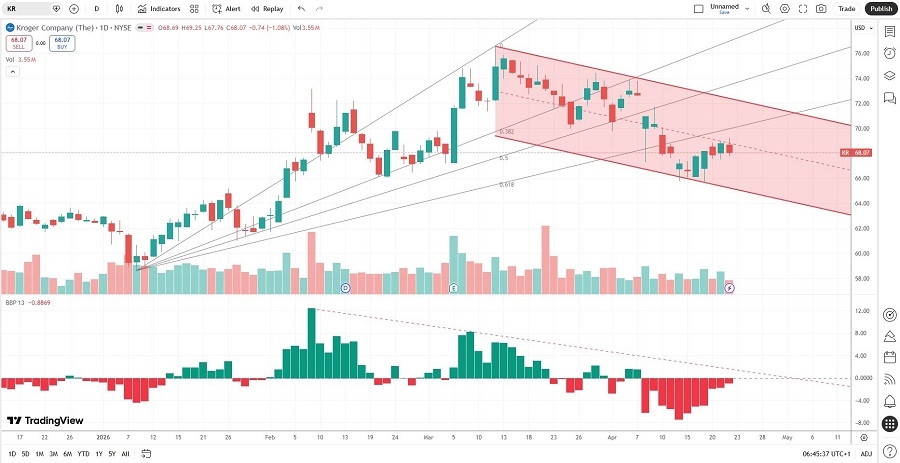
The Kroger Company Price Chart
The KR D1 chart shows price action inside a bearish price channel.
It also shows price action breaking down below its ascending Fibonacci Retracement Fan.
The Bull Bear Power Indicator is bearish and below its descending trendline.
The average bullish trading volumes are higher than the average bearish trading volumes, hinting at potential short-term volatility ahead.
KR retreated as the S&P 500 Index advanced, a bearish confirmation.
My KR Short Stock Trade
KR Entry Level: Between $67.51 and $69.25
KR Take Profit: Between $53.32 and $58.60
KR Stop Loss: Between $74.45 and $76.58
Risk/Reward Ratio: 2.05
Ready to trade our analysis of the Kroger Company? Here is our list of the best stockbrokers worth reviewing.