
Short Trade Idea
Enter your short position between $373.72 (the post-earnings intra-day) and $382.76 (Friday’s intra-day high).
Market Index Analysis
Tesla (NASDAQ:TSLA) is a member of the NASDAQ 100 Index, the S&P 100 Index, and the S&P 500 Index.
All three indices recorded fresh all-time highs, but downside risks have also risen.
The Bull Bear Power Indicator for the NASDAQ 100 Index is bullish with a negative divergence.
Market Sentiment Analysis
Equity futures are mostly higher this morning although Brent crude oil has just traded above $106 per barrel. However, markets have moved to ignore the long-term impacts of high oil prices, while earnings season will heat up this week. Microsoft, Alphabet, Amazon, and Meta will report their earnings on Wednesday, followed by Apple on Thursday. Volatility could increase amid rising red flags of the recent rally.
Tesla Fundamental Analysis
Tesla is one of the world’s most valuable companies by market capitalization, but it faces stiff competition from Chinese rivals. Expiring EV credits add to declining market share and shrinking profit margins.
So, why am I bearish on TSLA despite its upbeat earnings report?
Tesla reported first-quarter revenues of $22.39 billion with earnings per share of $0.41, beating expectations of $22.10 billion and $0.14, respectively. Still, I remain bearish amid its $25 billion in announced 2026 capital expenditures, up $5 billion from its previous estimate, for projects including Cybercab, Optimus, and the Terafab AI facility, which is expected to result in negative free cash flow. I am also bearish on excessive valuations and on the ongoing slowdown in deliveries amid rising inventories.
Metric | Value | Verdict |
P/E Ratio | 345.23 | Bearish |
P/B Ratio | 16.80 | Bearish |
PEG Ratio | 5.14 | Bearish |
Current Ratio | 2.04 | Bullish |
ROIC-WACC Ratio | Negative | Bearish |
Tesla Fundamental Analysis Snapshot
The price-to-earning (P/E) ratio of 345.23 makes TSLA an expensive stock. By comparison, the P/E ratio for the NASDAQ 100 Index is 35.63.
The average analyst price target for TSLA is $419.00. This suggests good upside potential, but downside risks are rising.
Tesla Technical Analysis
Today’s TSLA Signal
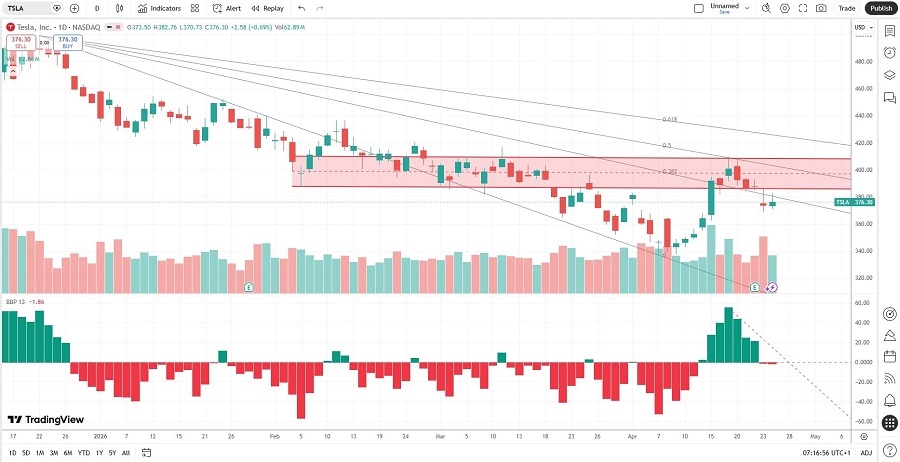
Tesla Price Chart
The TSLA D1 chart shows price action breaking down below a horizontal resistance zone.
It also shows price action between its descending 0.0% and 38.2% Fibonacci Retracement Fan levels.
The Bull Bear Power Indicator is bearish and below its descending trendline.
The average bearish trading volumes are higher than the average bullish trading volumes since the breakdown.
TSLA corrected as the NASDAQ 100 Index advanced, a bearish confirmation.
My TSLA Short Stock Trade
TSLA Entry Level: Between $373.72 and $382.76
TSLA Take Profit: Between $297.82 and $311.50
TSLA Stop Loss: Between $409.28 and $420.34
Risk/Reward Ratio: 2.13
Ready to trade our analysis of Tesla Here is our list of the best stockbrokers worth checking out.