
Long Trade Idea
Enter your Long position between $71.56 (yesterday’s intra-day low) and $74.41 (yesterday’s intra-day high).
Market Index Analysis
Sysco Corporation (NYSE:SYY) is a member of the S&P 500 Index.
This index retreated from its highs, driven lower by semiconductors tied to OpenAI.
The Bull Bear Power Indicator for the S&P 500 Index is bullish with a negative divergence.
Market Sentiment Analysis
Equity futures are moving higher this morning ahead of earnings from Alphabet, Amazon, Meta, and Microsoft, which will report after the close today, where the sole focus remains on capex. Yesterday’s report of a revenue miss at OpenAI sent NVIDIA, Oracle, and Broadcom lower. Robinhood, one of the favorite retail trading brokers, saw its shares plunge after reporting disappointing earnings, while Starbucks surged in after-hours trading.
Sysco Corporation Fundamental Analysis
Sysco Corporation is the world’s largest food distributor. It has over 700,000 customers and operates 340 distribution centers in ten countries.
So, why am I bullish on SYY despite its earnings miss?
Sysco Corporation narrowly missed revenue and earnings-per-share expectations of $20.56 billion and $0.95 by reporting $20.52 billion and $0.94, respectively. Still, the 3.3% rise in local case volume represented the best growth in three years, confirming rising market share. The $29.1 billion Restaurant Depot acquisition, expected to be immediately accretive, anchors my bullish case. Despite the acquisition, SYY confirmed its full-year EPS guidance and improved margins by implementing AI tools to boost productivity and customer retention.
Metric | Value | Verdict |
P/E Ratio | 20.38 | Bullish |
P/B Ratio | 15.78 | Bearish |
PEG Ratio | 1.01 | Bullish |
Current Ratio | 1.33 | Bearish |
ROIC-WACC Ratio | Positive | Bullish |
Sysco Corporation Fundamental Analysis Snapshot
The price-to-earnings (P/E) ratio of 20.38 makes SYY an expensive stock. By comparison, the P/E ratio for the S&P 500 Index is 25.79.
The average analyst price target for SYY is $87.33. This suggests good upside potential with manageable downside risks.
Sysco Corporation Technical Analysis
Today’s SYY Signal
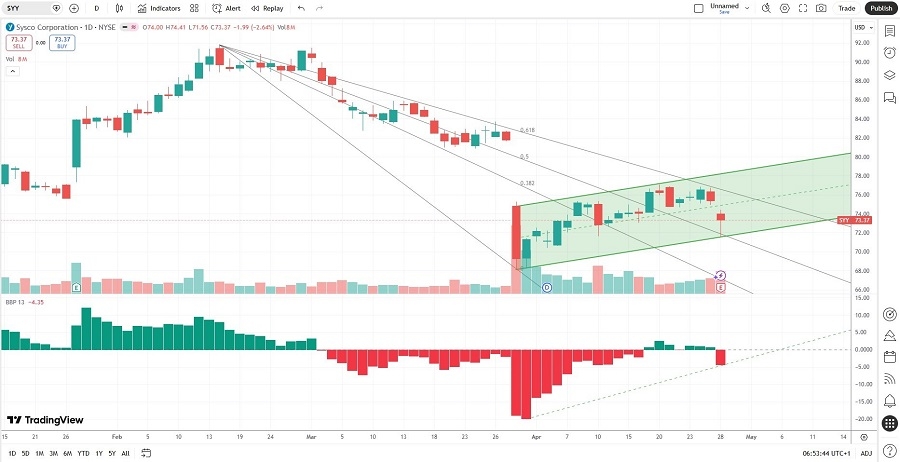
Sysco Corporation Price Chart
The SYY D1 chart shows price action inside a bullish price channel.
It also shows price action between its descending 50.0% and 61.8% Fibonacci Retracement Fan levels.
The Bull Bear Power Indicator turned bearish but remains above its ascending trendline.
The average bearish trading volumes are higher than the average bullish trading volumes, hinting at potentially more short-term volatility.
SYY dropped more than the S&P 500 Index, a bearish confirmation, but bullish catalysts are accumulating.
My SYY Long Stock Trade
SYY Entry Level: Between $71.56 and $74.41
SYY Take Profit: Between $88.44 and $91.85
SYY Stop Loss: Between $64.41 and $67.12
Risk/Reward Ratio: 2.36
Ready to trade our analysis of Sysco Corporation? Here is our list of the best stockbrokers worth checking out.