
Short Trade Idea
Enter your short position between $104.82 (an intermediate horizontal support level) and $107.27 (the upper band of its horizontal resistance zone).
Market Index Analysis
Starbucks (NASDAQ:SBUX) is a member of the NASDAQ 100 Index, the S&P 100 Index, and the S&P 500 Index.
All three indices are forming a new horizontal resistance zone supported by fading bullish trading volumes.
The Bull Bear Power Indicator for the S&P 500 Index is bullish with a negative divergence.
Market Sentiment Analysis
Equity futures are sliding this morning with oil prices surging after the US military briefed President Trump on military action after he stated he would continue the blockade of Iranian ports until a nuclear deal is reached. It has increased the risk of economic stagflation. On the earnings front, Meta and Microsoft fell in after-market action, while Alphabet and Qualcomm surged, and markets await Apple earnings after the bell today.
Starbucks Fundamental Analysis
Starbucks is the world’s largest coffeehouse chain. Many credit it with launching the second wave of the global coffee culture. The company serves customers in 80 countries from over 35,700 stores.
So, why am I bearish on SBUX despite its earnings beat?
Starbucks delivered a solid earnings beat, reporting revenue of $9.53 billion and earnings per share of $0.50, beating expectations of $9.17 billion and $0.43, respectively. Still, I remain bearish due to a 50%+ slump in net profit margins from 10.4% to 5.0%. Valuations are excessive, and I see no upside potential from current levels amid financial challenges and international underperformance, evidenced by the 21% plunge in profitability.
Metric | Value | Verdict |
P/E Ratio | 80.53 | Bearish |
P/B Ratio | 68.46 | Bearish |
PEG Ratio | 1.68 | Bullish |
Current Ratio | 1.05 | Bearish |
ROIC-WACC Ratio | Negative | Bearish |
Starbucks Fundamental Analysis Snapshot
The price-to-earning (P/E) ratio of 80.53 makes SBUX an expensive stock. By comparison, the P/E ratio for the S&P 500 Index is 30.78.
The average analyst price target for SBUX is $104.62. This suggests no upside potential with excessive downside risks.
Starbucks Technical Analysis
Today’s SBUX Signal
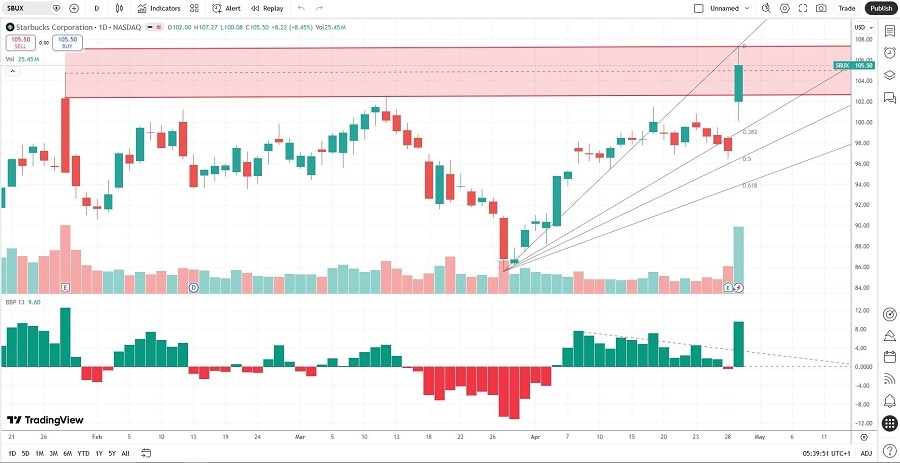
Starbucks Price Chart
The SBUX D1 chart shows price action forming a new horizontal resistance zone.
It also shows price action between its ascending 0.0% and 38.2% Fibonacci Retracement Fan levels.
The Bull Bear Power Indicator spiked into unsustainable bullish conditions above its descending trendline.
The average bullish trading volumes are higher than the average bearish trading volumes, hinting at more short-term volatility ahead.
SBUX rallied as the S&P 500 Index retreated, a bullish confirmation, but bearish catalysts are accumulating.
My SBUX Short Stock Trade
SBUX Entry Level: Between $104.82 and $107.27
SBUX Take Profit: Between $85.60 and $88.16
SBUX Stop Loss: Between $113.71 and $117.12
Risk/Reward Ratio: 2.16
Ready to trade our analysis of Starbucks? Here is our list of the best stockbrokers worth reviewing.