
Long Trade Idea
Enter your Long position between $178.87 (the upper band of its horizontal support zone) and $184.29 (yesterday’s intra-day high).
Market Index Analysis
Salesforce (NYSE:CRM) is a member of the Dow Jones Industrial Average Index, the S&P 100 Index, and the S&P 500 Index.
All three indices continue to record fresh all-time highs amid lower trading volumes.
The Bull Bear Power Indicator for the S&P 500 Index is bullish with a negative divergence.
Market Sentiment Analysis
Equity futures trade mixed after the record-setting rally in the S&P 500 Index and the NASDAQ 100 Index continues despite mounting concerns, once again driven by AI-related developments. OpenAI’s revenue miss served as the latest warning. US President Trump discussed Iran’s peace proposal with top aides but has not yet announced a decision. Earnings season will continue to offer catalysts.
Salesforce Fundamental Analysis
Salesforce is a cloud-based software company focused on sales, customer service, marketing automation, e-commerce, analytics, artificial intelligence, and application development. CRM is one of the 100 largest companies by market capitalization globally, and the world’s largest enterprise applications firm.
So, why am I bullish on CRM after its breakout?
Salesforce announced that Agentforce surpassed 8,000 total engagements and generated $800+ million in ARR, while Data Cloud + AI exceeded $1 billion in ARR, which underpins my bullish stance. The $8 billion Informatica acquisition will strengthen its metadata management, master data, and ETL capabilities. I am equally bullish on its new consumption-based pricing model, Flex Credits, a usage-based model, lowering adoption barriers, which I expect to drive revenue generation.
Metric | Value | Verdict |
P/E Ratio | 23.10 | Bullish |
P/B Ratio | 2.49 | Bullish |
PEG Ratio | 0.98 | Bullish |
Current Ratio | 0.76 | Bearish |
ROIC-WACC Ratio | Negative | Bearish |
Salesforce Fundamental Analysis Snapshot
The price-to-earnings (P/E) ratio of 23.10 makes CRM an inexpensive stock. By comparison, the P/E ratio for the S&P 500 is 25.79.
The average analyst price target for CRM is $268.87. This suggests excellent upside potential with acceptable downside risks.
Salesforce Technical Analysis
Today’s CRM Signal
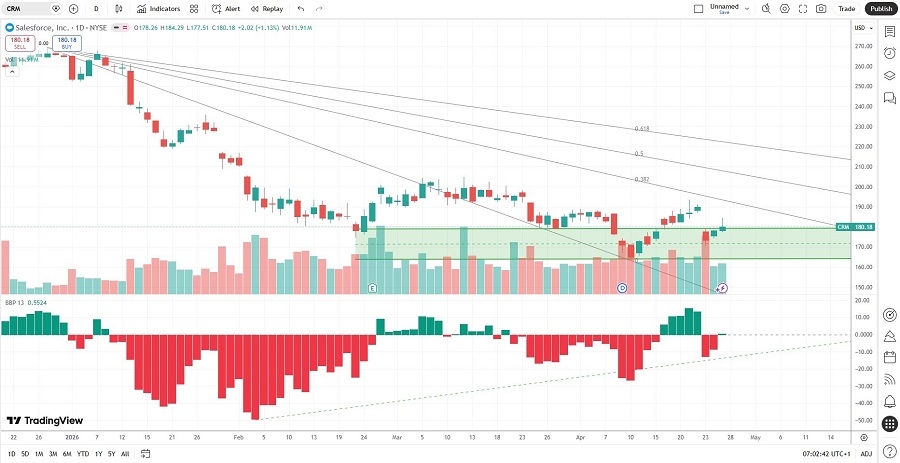
Salesforce Price Chart
The CRM D1 chart shows price action breaking out above its horizontal support zone.
It also shows price action between its descending 0.0% and 38.2% Fibonacci Retracement Fan levels.
The Bull Bear Power Indicator turned bullish with an ascending trendline.
The average bearish trading volumes are higher than the average bullish trading volumes, hinting at potentially more short-term volatility.
CRM moved higher with the S&P 500, a bullish confirmation.
My CRM Long Stock Trade
CRM Entry Level: Between $178.87 and $184.29
CRM Take Profit: Between $260.91 and $269.11
CRM Stop Loss: Between $150.48 and $156.40
Risk/Reward Ratio: 2.89
Ready to trade our analysis of Salesforce? Here is our list of the best stockbrokers worth reviewing.