
Long Trade Idea
Enter your long position between $49.77 (Friday’s intra-day low) and $51.51 (yesterday’s intra-day high).
Market Index Analysis
PayPal (NASDAQ:PYPL) is a member of the NASDAQ 100 Index, the S&P 100 Index, and the S&P 500 Index.
All three indices are retreating from all-time highs, but remain at elevated levels, disconnected from economic reality.
The Bull Bear Power Indicator for the NASDAQ 100 Index is in extremely bullish territory with a descending trendline.
Market Sentiment Analysis
The fragile ceasefire between the US and Iran is set to end this week. In corporate news, Apple CEO Tim Cook will step down on September 1st, and Tom Ternus will take over. The confirmation hearing for Kevin Warsh as the next Federal Reserve chair is ongoing, while earnings releases from United Airlines, Intel, and Tesla will highlight the week.
PayPal Fundamental Analysis
PayPal is a financial technology company focused on mobile and online payments. It added support for cryptocurrency purchases, operates in 202 markets, has 425M active accounts, and supports 25 fiat currencies.
So, why am I bullish on PYPL amid its recent 33%+ rally?
PayPal is enjoying a resurgence in demand amid low valuations, strategic partnerships, including its most recent Canva integration, where its 265+ million active users can use PayPal Links at check-out pages, and its expansion into Brazil via Brazil’s Pix instant payment system. I am equally bullish on its Agentic AI strategy driven by partnerships with OpenAI and Meta. PayPal also delivers exceptional free cash flow, adding another bullish catalyst.
Metric | Value | Verdict |
P/E Ratio | 9.51 | Bullish |
P/B Ratio | 2.26 | Bullish |
PEG Ratio | 0.92 | Bullish |
Current Ratio | 1.29 | Bearish |
ROIC-WACC Ratio | Positive | Bullish |
PayPal Fundamental Analysis Snapshot
The price-to-earnings (P/E) ratio of 9.51 makes PYPL an inexpensive stock. By comparison, the P/E ratio for the NASDAQ 100 Index is 34.70.
The average analyst price target for PYPL is $52.85. This suggests negligible upside potential, but I see notably more upside ahead, while downside risks are acceptable.
PayPal Technical Analysis
Today’s PYPL Signal
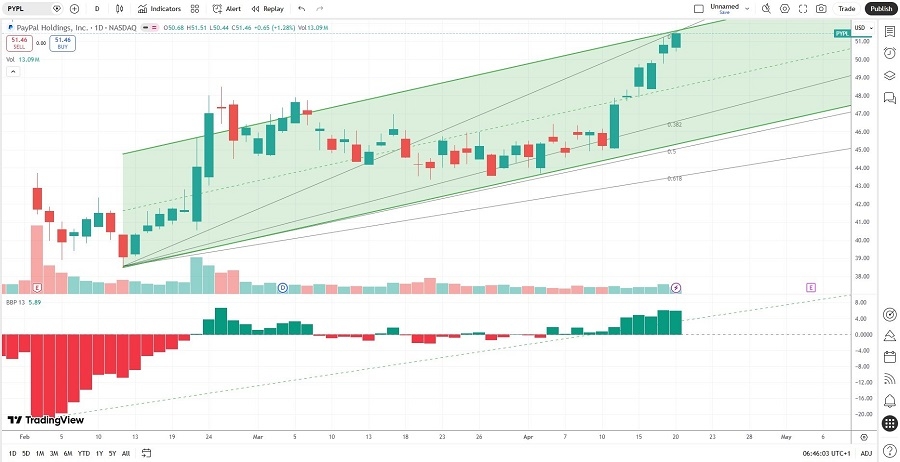
PayPal Price Chart
The PYPL D1 chart shows price action inside a bullish price channel.
It also shows price action between its ascending 0.0% and 38.2% Fibonacci Retracement Fan levels.
The Bull Bear Power Indicator is bullish with an ascending trendline.
The average bullish trading volumes are higher than the average bearish trading volumes.
PYPL accelerated more than the NASDAQ 100 Index, a bullish confirmation.
My PYPL Long Stock Trade
PYPL Entry Level: Between $49.77 and $51.51
PYPL Take Profit: Between $69.05 and $70.70
PYPL Stop Loss: Between $40.53 and $43.55
Risk/Reward Ratio: 2.09
Ready to trade our analysis of PayPal? Here is our list of the best stockbrokers worth checking out.