
Short Trade Idea
Enter your short position between $187.92 (yesterday’s intra-day low) and $194.59 (the upper band of its horizontal resistance zone).
Market Index Analysis
Morgan Stanley (NYSE:MS) is a member of the S&P 100 Index and the S&P 500 Index.
Both indices are pushing to fresh all-time highs on low trading volumes, lacking confirmation.
The Bull Bear Power Indicator for the S&P 500 Index is extremely bullish, confirming a disconnect to economic reality.
Market Sentiment Analysis
Equity futures are inching higher this morning after the S&P 500 index and the NASDAQ 100 index recorded fresh all-time highs. Markets once again price geopolitics and earnings outlooks for the current quarter to perfection, including receding inflation and interest rate cuts. Netflix, PepsiCo, and Charles Schwab will report earnings today, while initial jobless claims and industrial production data are also due.
Morgan Stanley Fundamental Analysis
Morgan Stanley is an investment bank and financial services company with offices in 42 countries and over 80,000 employees. Its three business segments are Institutional Securities, Wealth Management, and Investment Management.
So, why am I bearish on MS following its earnings release?
Morgan Stanley reported revenues of $20.58 billion and earnings per share of $3.43, above revenue expectations of $19.74 billion and earnings per share expectations of $3.02. I remain bearish amid market complacency and valuations that price the share to perfection, leaving no room for surprises in the current quarter. Geopolitical tension and uncertainty could dent the appetite for M&A and IPO activity, core revenue drivers for Morgan Stanley.
Metric | Value | Verdict |
P/E Ratio | 18.77 | Bullish |
P/B Ratio | 2.97 | Bearish |
PEG Ratio | 2.15 | Bearish |
Current Ratio | 2.05 | Bullish |
ROIC-WACC Ratio | Negative | Bearish |
Morgan Stanley Fundamental Analysis Snapshot
The price-to-earnings (P/E) ratio of 18.77 makes MS an inexpensive stock. By comparison, the P/E ratio for the S&P 500 Index is 30.16.
The average analyst price target for MS is $191.76. This suggests no upside potential with massive downside risks.
Morgan Stanley Technical Analysis
Today’s MS Signal
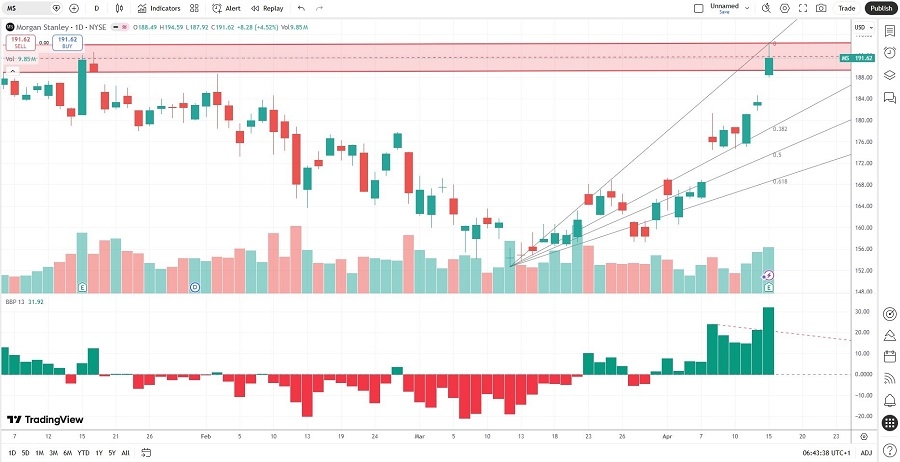
Morgan Stanley Price Chart
The MS D1 chart shows price action inside its horizontal resistance zone.
It also shows price action between its ascending 0.0% and 38.2% Fibonacci Retracement Fan levels.
The Bull Bear Power Indicator is bullish and moved above its descending trendline.
The average bearish trading volumes are higher than the average bullish trading volumes.
MS rallied with the S&P 500 Index, a bullish confirmation, but breakdown catalysts are rising.
My MS Short Stock Trade
MS Entry Level: Between $187.92 and $194.59
MS Take Profit: Between $152.80 and $157.22
MS Stop Loss: Between $200.43 and $206.44
Risk/Reward Ratio: 2.81
Ready to trade our analysis of Morgan Stanley? Here is our list of the best stock brokers worth reviewing.