
Long Trade Idea
Enter your long position between $411.21 (the upper band of its horizontal support zone) and $420.29 (yesterday’s intra-day low).
Market Index Analysis
Microsoft (NASDAQ:MSFT) is a member of the NASDAQ 100 Index, the Dow Jones Industrial Average Index, the S&P 100 Index, and the S&P 500 Index.
All four indices are forming a new horizontal resistance zone supported by fading bullish trading volumes.
The Bull Bear Power Indicator for the NASDAQ 100 Index is bullish with a negative divergence.
Market Sentiment Analysis
Equity futures are sliding this morning with oil prices surging after the US military briefed President Trump on military action after he stated he would continue the blockade of Iranian ports until a nuclear deal is reached. It has increased the risk of stagflation for the economy. On the earnings front, MSFT and Microsoft fell in after-market action, while Alphabet and Qualcomm surged, and markets await Apple earnings after the bell today.
Microsoft Fundamental Analysis
Microsoft is the largest software maker, one of the most valuable public companies, and one of the most valuable brands globally. It is a significant player in cloud services, gaming, and AI, following its massive investment in OpenAI.
So, why am I bullish on MSFT amid its post-earnings dip?
Microsoft beat revenue expectations of $81.4 billion and earnings-per-share expectations of $4.05, reporting $82.89 billion and $4.27, respectively, while also boosting its capex guidance to record levels, sending shares lower in after-market action. I remain bullish on its record cloud and AI-related performance, driven by Azure and AI monetization. Valuations are low, its hybrid pricing model is a revenue-generator, and the new OpenAI partnership agreement adds another bullish catalyst.
Metric | Value | Verdict |
P/E Ratio | 26.58 | Bullish |
P/B Ratio | 8.15 | Bearish |
PEG Ratio | 1.35 | Bullish |
Current Ratio | 1.39 | Bearish |
ROIC-WACC Ratio | Positive | Bullish |
Microsoft Fundamental Analysis Snapshot
The price-to-earnings (P/E) ratio of 26.58 makes MSFT an inexpensive stock. By comparison, the P/E ratio for the NASDAQ 100 Index is 35.48.
The average analyst target for MSFT is $570.72. This suggests excellent upside potential with reasonable downside risks.
Microsoft Technical Analysis
Today’s MSFT Signal
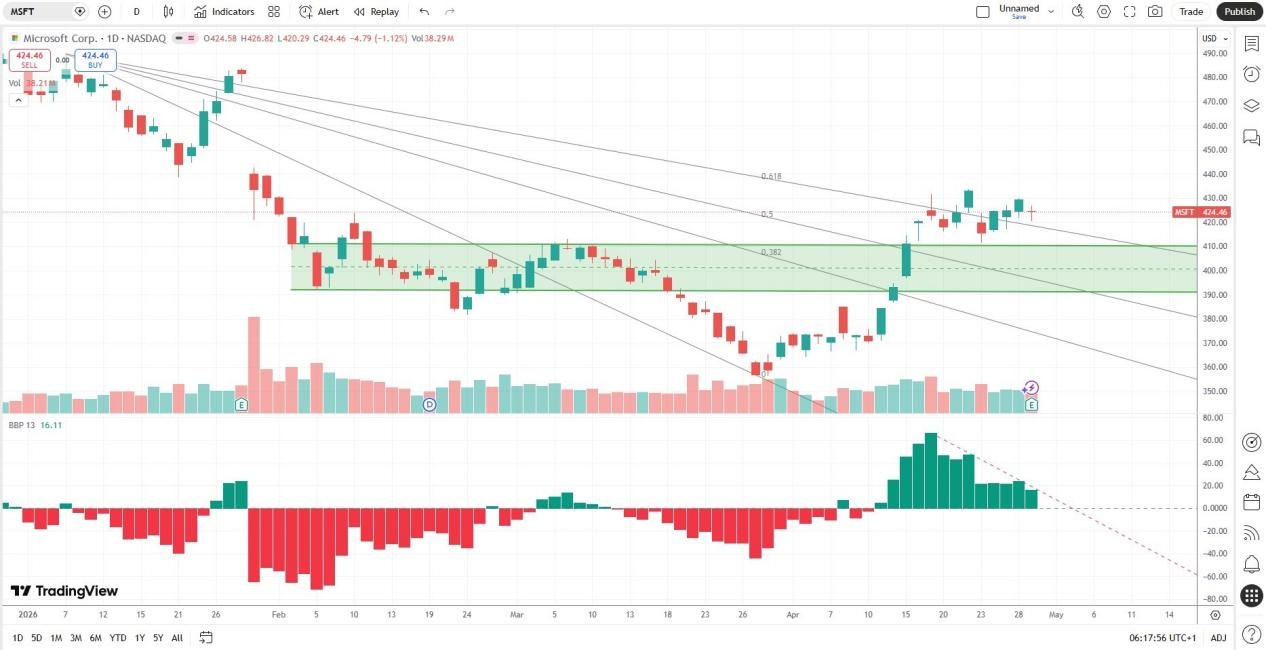
Microsoft Price Chart
The MSFT D1 chart shows price action above its horizontal support zone.
It also shows price action above its descending Fibonacci Retracement Fan.
The Bull Bear Power Indicator is bullish but below its descending trendline.
The average bearish trading volumes are higher than the average bullish trading volumes, suggesting more short-term volatility potential.
MSFT rallied with the NASDAQ 100 Index, a bullish confirmation.
My MSFT Long Stock Trade
MSFT Entry Level: Between $411.21 and $420.29
MSFT Take Profit: Between $499.12 and $513.50
MSFT Stop Loss: Between $370.03 and $381.71
Risk/Reward Ratio: 2.14
Ready to trade our analysis of Microsoft? Here is our list of the best stockbrokers worth reviewing.