
Long Trade Idea
Enter your long position between $398.88 (yesterday’s intra-day low) and $416.00 (yesterday’s intra-day high).
Market Index Analysis
Micron Technology (NASDAQ:MU) is a member of the NASDAQ 100 Index and the S&P 500 Index.
Both indices spiked higher yesterday, but low bullish trading volumes suggest caution ahead, as they do not confirm the recent six-day rally.
The Bull Bear Power Indicator for the NASDAQ 100 Index turned bullish and spiked above its descending trendline.
Market Sentiment Analysis
Equity futures are drifting lower after Iran accused the US of violating the fragile ceasefire and three points of its 10-point proposal. The Strait of Hormuz remains functionally closed, which was one of the most core US demands. Oil prices are approaching $100 per barrel again, and markets await US PCE Price Index data, the Federal Reserve’s preferred inflation gauge.
Micron Technology Fundamental Analysis
Micron Technology manufactures computer memory and computer data storage, including dynamic random-access memory (DRAM), high-bandwidth memory (HBM), flash memory, and solid-state drives (SSDs), which are essential for data centers and AI applications.
So, why am I bullish on MU following its breakout?
Micron Technology issued record Q3 revenue guidance of $33.5 billion, significantly exceeding consensus estimates, confirmed this month, driven by AI-driven demand for data center memory, particularly HBM3E and HBM4. It also noted gross margins should reach 81%, and that its 2026 (HBM) production capacity is sold out under non-cancellable, long-term agreements. I am equally bullish on its dividend hike and bullish price target revisions by a cohort of analysts.
Metric | Value | Verdict |
P/E Ratio | 17.82 | Bullish |
P/B Ratio | 5.70 | Bearish |
PEG Ratio | 0.21 | Bullish |
Current Ratio | 2.90 | Bullish |
ROIC-WACC Ratio | Positive | Bullish |
Micron Technology Fundamental Analysis Snapshot
The price-to-earnings (P/E) ratio of 17.82 makes MU an inexpensive stock. By comparison, the P/E ratio for the NASDAQ 100 Index is 35.13.
The average analyst price target for MU is $525.47. This suggests there is excellent upside potential with reasonable downside risks.
Micron Technology Technical Analysis
Today’s MU Signal
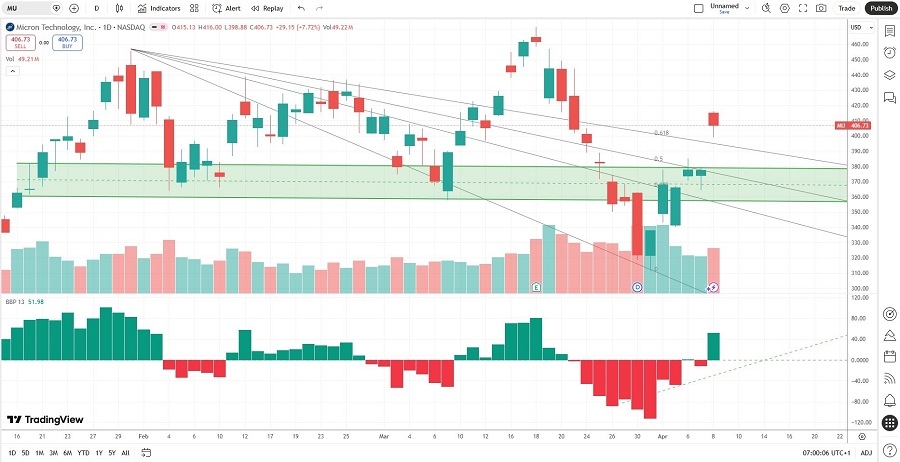
Micron Technology Price Chart
The MU D1 chart shows price action breaking out above its horizontal support zone.
It also shows price action breaking out above its descending Fibonacci Retracement Fan.
The Bull Bear Power Indicator turned bullish with an ascending trendline.
The average bearish trading volumes are higher than the average bullish trading volumes, suggesting more short-term volatility.
MU followed the NASDAQ 100 Index higher, a bullish confirmation.
My MU Long Stock Trade
MU Entry Level: Between $398.88 and $416.00
MU Take Profit: Between $509.71 and $525.47
MU Stop Loss: Between $348.91 and $357.67
Risk/Reward Ratio: 2.22
Ready to trade our analysis of Micron Technology? Here is our list of the best stock brokers worth checking out.