
Long Trade Idea
Enter your long position between $609.55 (the upper band of its horizontal support zone) and $624.33 (an intermediate horizontal resistance level).
Market Index Analysis
Meta Platforms (NASDAQ:META) is a member of the NASDAQ 100 Index, the S&P 100 Index, and the S&P 500 Index.
All three indices are forming a new horizontal resistance zone supported by fading bullish trading volumes.
The Bull Bear Power Indicator for the NASDAQ 100 Index is bullish with a negative divergence.
Market Sentiment Analysis
Equity futures are sliding this morning with oil prices surging after the US military briefed President Trump on military action after he stated he would continue the blockade of Iranian ports until a nuclear deal is reached. This has increased the risk of economic stagflation. On the earnings front, Meta and Microsoft fell in after-market action, while Alphabet and Qualcomm surged, and markets await Apple earnings after the bell today.
Meta Platforms Fundamental Analysis
Meta Platforms is one of the world’s biggest spenders on research & development, a member of the US Big Five Tech Companies, and the Magnificent Seven. It is an industry leader in the metaverse and has now embarked on a hiring spree to become a leader in advanced AI and superintelligence.
So, why am I bullish on META despite its post-earnings sell-off?
Meta Platforms reported revenues of $56.31 billion with earnings per share of $10.44, beating expectations of $55.56 billion and $6.67, respectively, while shares plunged in after-hours markets amid increased capex guidance. Still, I am buying the dip amid low valuations, its dominant advertising performance, sustained user engagement despite legal challenges, and upbeat 2026 guidance.
Metric | Value | Verdict |
P/E Ratio | 24.33 | Bullish |
P/B Ratio | 6.97 | Bearish |
PEG Ratio | 1.09 | Bullish |
Current Ratio | 2.60 | Bullish |
ROIC-WACC Ratio | Positive | Bullish |
Meta Platforms Fundamental Analysis Snapshot
The price-to-earnings (P/E) ratio of 24.33 makes META an inexpensive stock. By comparison, the P/E ratio for the NASDAQ 100 Index is 35.48.
The average analyst price target for META is $855.11. This suggests excellent upside potential with acceptable downside risks.
Meta Platforms Technical Analysis
Today’s META Signal
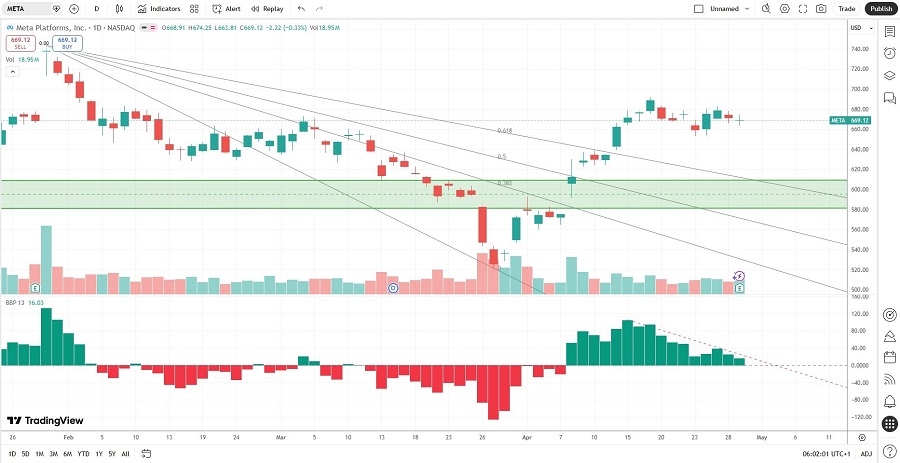
Meta Platforms Price Chart
The META D1 chart shows price action above its horizontal support zone.
It also shows price action above its descending Fibonacci Retracement Fan.
The Bull Bear Power Indicator is bullish but below its descending trendline.
The average bullish trading volumes are higher than the average bearish trading volumes.
META rallied with the NASDAQ 100 Index, a bullish confirmation.
My META Long Stock Trade
META Entry Level: Between $609.55 and $624.33
META Take Profit: Between $732.17 and $744.00
META Stop Loss: Between $558.49 and $572.39
Risk/Reward Ratio: 2.40
Ready to trade our analysis of Meta Platforms? Here is our list of the best stockbrokers worth reviewing.