
Short Trade Idea
Enter your short position between $79.63 (Friday’s intra-day low) and $85.22 (Friday’s intra-day high).
Market Index Analysis
Intel (NASDAQ:INTC) is a member of the NASDAQ 100 Index, the Dow Jones Industrial Average Index, the S&P 100 Index, and the S&P 500 Index.
Three of the four indices recorded fresh all-time highs, but downside risks have also risen.
The Bull Bear Power Indicator for the NASDAQ 100 Index is bullish with a negative divergence.
Market Sentiment Analysis
Equity futures are mostly higher this morning although Brent crude oil has just traded above $106 per barrel. However, markets have moved to ignore the long-term impacts of high oil prices, while earnings season will heat up this week. Microsoft, Alphabet, Amazon, and Meta will report their earnings on Wednesday, followed by Apple on Thursday. Volatility could increase amid rising red flags of the recent rally.
Intel Fundamental Analysis
Intel is a technology company that primarily designs CPUs for business and consumer markets. It lost its leadership position to AMD and missed out on the AI wave, while its future chips will rely heavily on TSMC.
So, why am I bearish on INTC after it recorded a fresh all-time high?
While Intel beat expectations with expected revenues of $12.42 billion and earnings per share of $0.01, reporting $13.58 billion and $0.29, respectively, during its latest earnings release, the rally to all-time highs, eclipsing its dot-com peak, was disconnected from economic reality. I remain bearish on its foundry business, massive capital expenditures, and stretched valuations. Its Gaudi chips have negligible traction, and shares have no visible upside from current levels.
Metric | Value | Verdict |
P/E Ratio | 904.17 | Bearish |
P/B Ratio | 3.01 | Bearish |
PEG Ratio | 0.50 | Bullish |
Current Ratio | 2.02 | Bullish |
ROIC-WACC Ratio | Negative | Bearish |
Intel Fundamental Analysis Snapshot
The price-to-earnings (P/E) ratio of 904.17 makes INTC an expensive stock. By comparison, the P/E ratio for the NASDAQ 100 Index is 35.63.
The average analyst price target for INTC is $55.33. This suggests no upside potential with massive downside risks.
Intel Technical Analysis
Today’s INTC Signal
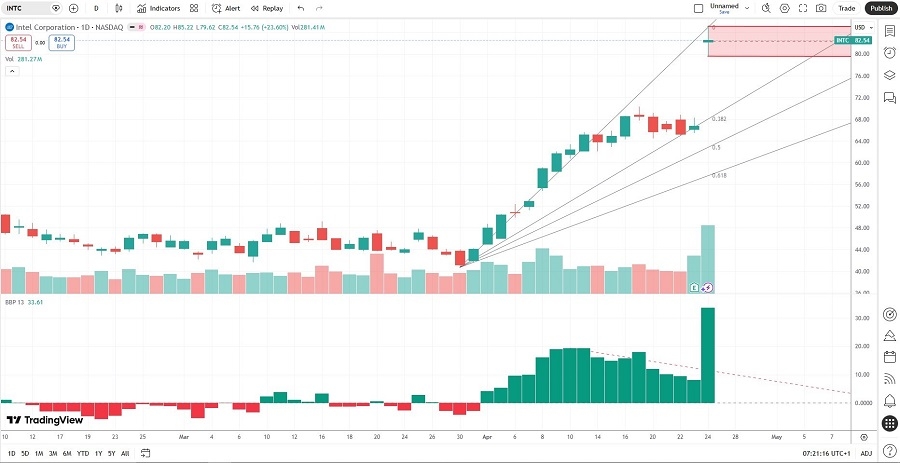
Intel Price Chart
The INTC D1 chart shows price action forming a new horizontal resistance zone.
It also shows price action between its ascending 0.0% and 38.2% Fibonacci Retracement Fan levels.
The Bull Bear Power Indicator spiked into unsustainable bullish conditions above its descending trendline.
The average bullish trading volumes are higher than the average bearish trading volumes, suggesting more short-term volatility ahead.
INTC surged with the NASDAQ 100 Index, a bullish confirmation, but bearish catalysts dominate the picture.
My INTC Short Stock Trade
INTC Entry Level: Between $79.63 and $85.22
INTC Take Profit: Between $62.09 and $65.42
INTC Stop Loss: Between $87.78 and $90.41
Risk/Reward Ratio: 2.15
Ready to trade our analysis of Intel? Here is our list of the best stockbrokers worth checking out.