
Short Trade Idea
Enter your short position between $209.82 (Friday’s intra-day low) and $214.70 (Friday’s intra-day high).
Market Index Analysis
Honeywell International (NASDAQ:HON) is a member of the Dow Jones Industrial Average Index, the NASDAQ 100 Index, the S&P 100 Index, and the S&P 500 Index.
Three of the four indices recorded fresh all-time highs, but downside risks have also risen.
The Bull Bear Power Indicator for the S&P 500 Index is bullish with a negative divergence.
Market Sentiment Analysis
Equity futures are mostly higher this morning although Brent crude oil has just traded above $106 per barrel.. However, markets have moved to ignore the long-term impacts of high oil prices, while earnings season will heat up this week. Microsoft, Alphabet, Amazon, and Meta will report their earnings on Wednesday, followed by Apple on Thursday. Volatility could increase amid rising red flags of the recent rally.
Honeywell International Fundamental Analysis
Honeywell International is a conglomerate with aerospace, building automation, industrial automation, and energy and sustainability solutions (ESS) at its core. Additionally, it operates Sandia National Laboratories and has a global workforce of over 100,000 employees.
So, why am I bearish on HON following its earnings miss?
Honeywell reported revenues of $9.14 billion, missing estimates of $9.30 billion, but beating earnings-per-share expectations of $2.32 by reporting $2.45. Still, I remain bearish amid weak guidance, citing disruptions from the US-Iran war. I am also concerned by the 71% year-over-year decline in free cash flow to $56 million, while current disruptions from the Iran war could become longer-term issues for full-year operations.
Metric | Value | Verdict |
P/E Ratio | 34.00 | Bearish |
P/B Ratio | 9.77 | Bearish |
PEG Ratio | 1.95 | Bullish |
Current Ratio | 1.38 | Bearish |
ROIC-WACC Ratio | Positive | Bullish |
Honeywell International Fundamental Analysis Snapshot
The price-to-earning (P/E) ratio of 34.00 makes HON an expensive stock. By comparison, the P/E ratio for the S&P 500 Index is 25.65.
The average analyst’s price target for HON is $251.70. This suggests moderate upside potential, but downside risks are greater.
Honeywell International Technical Analysis
Today’s HON Signal
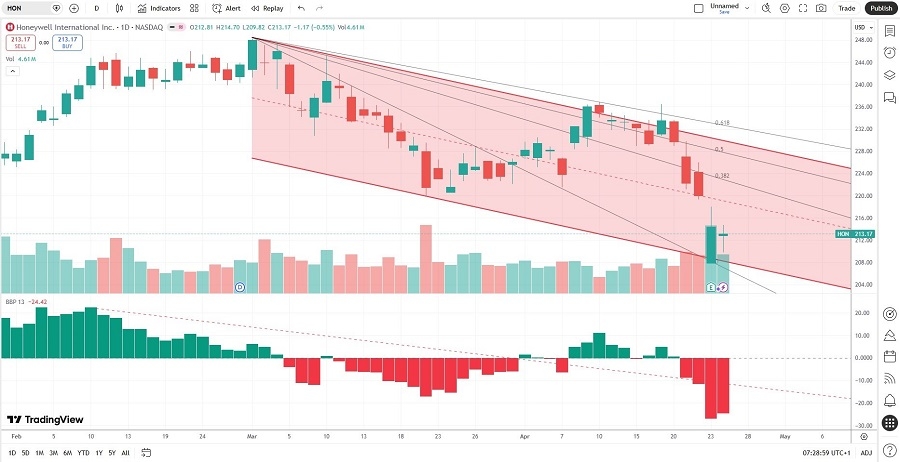
Honeywell International Price Chart
The HON D1 chart shows price action inside a bearish price channel.
It also shows price action between its descending 0.0% and 38.2% Fibonacci Retracement Fan levels.
The Bull Bear Power Indicator is bearish and below its descending trendline.
The average bearish trading volumes are higher than the average bullish trading volumes.
HON corrected as the S&P 500 Index rallied, a significant bearish trading signal.
My HON Short Stock Trade
HON Entry Level: Between $209.82 and $214.70
HON Take Profit: Between $177.88 and $181.01
HON Stop Loss: Between $224.65 and $229.79
Risk/Reward Ratio: 2.15
Ready to trade our analysis of Honeywell? Here is our list of the best stockbrokers worth checking out.