
Short Trade Idea
Enter your short position between $881.65 (yesterday’s intra-day low) and $896.94 (an intermediate horizontal support level).
Market Index Analysis
Goldman Sachs (NYSE:GS) is a member of the Dow Jones Industrial Average Index, the S&P 100 Index, and the S&P 500 Index.
All three indices have rallied on low bullish trading volumes, making them vulnerable to a reversal.
The Bull Bear Power Indicator for the S&P 500 Index is bullish but risks the development of a negative divergence.
Market Sentiment Analysis
Equity futures are steady this morning amid cautious optimism that the US and Iran will reach a peace deal, after US President Trump claimed that Iran has reached out following the apparent US blockade of Iranian ports. Crude Oil dropped below $100 per barrel but remains uncomfortably high. Global consumer confidence continues to plunge, Chinese exports missed expectations, and markets will refocus on earnings season, where the AI trade will remain dominant.
Goldman Sachs Fundamental Analysis
Goldman Sachs is a multinational investment bank and financial services company. It ranks as the largest investment bank globally by revenue. The Financial Stability Board considers GS a systemically important financial institution.
So, why am I bearish on GS following its earnings release?
Goldman Sachs reported revenues of $17.23 billion and earnings per share of $17.55, beating estimates of $16.97 billion and $16.49, respectively, amid record equities trading. Still, shares sold off after the earnings release, and I remain bearish amid an uncertain outlook and aggressive insider selling of nearly $110 million. Macroeconomic headwinds could further dent Goldman Sachs’ investment banking revenue amid a cooling IPO market.
Metric | Value | Verdict |
P/E Ratio | 16.26 | Bullish |
P/B Ratio | 2.14 | Bullish |
PEG Ratio | 1.62 | Bullish |
Current Ratio | 1.53 | Bearish |
ROIC-WACC Ratio | Negative | Bearish |
Goldman Sachs Fundamental Analysis Snapshot
The price-to-earning (P/E) ratio of 16.26 makes GS an inexpensive stock. By comparison, the P/E ratio for the S&P 500 Index is 26.17.
The average analyst price target for GS is $933.75. This suggests moderate upside potential with rising downside risks.
Goldman Sachs Technical Analysis
Today’s GS Signal
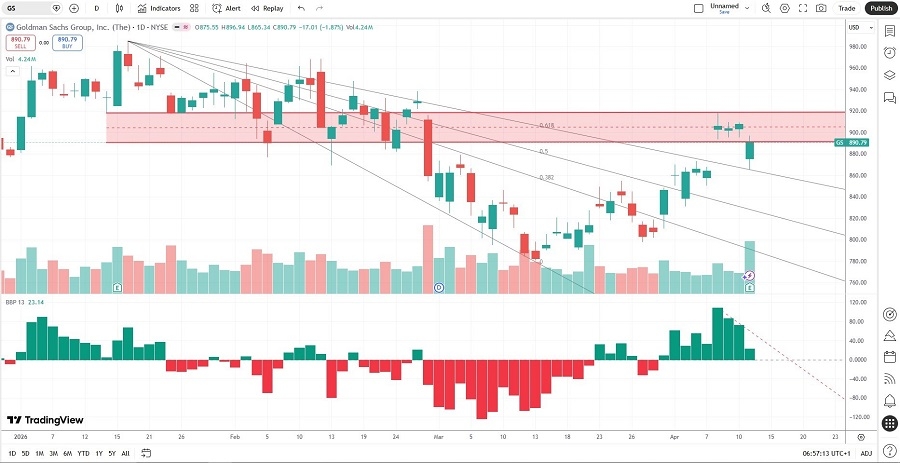
Goldman Sachs Price Chart
The GS D1 chart shows price action breaking down below its horizontal resistance zone.
It also shows price action breaking out above its descending Fibonacci Retracement Fan.
The Bull Bear Power Indicator is bullish with a descending trendline, nearing a bearish crossover.
The average bullish trading volumes are higher than the average bearish trading volumes, hinting at more short-term volatility.
GS moved higher with the S&P 500 Index, a bullish confirmation, but downside catalysts are accumulating.
My GS Short Stock Trade
GS Entry Level: Between $881.65 and $896.94
GS Take Profit: Between $780.50 and $790.59
GS Stop Loss: Between $918.12 and $933.75
Risk/Reward Ratio: 2.77
Ready to trade our analysis of Goldman Sachs? Here is our list of the best stock brokers worth checking out.