
Short Trade Idea
Enter your short position between $77.76 (an intermediate horizontal support level) and $79.33 (the lower band of its horizontal resistance zone).
Market Index Analysis
General Motors (NYSE:GM) is a member of the Dow Jones Industrial Average Index, the S&P 100 Index, and the S&P 500 Index.
All three indices retreated from their highs, driven lower by semiconductors tied to OpenAI.
The Bull Bear Power Indicator for the S&P 500 Index is bullish with a negative divergence.
Market Sentiment Analysis
Equity futures are moving higher this morning ahead of earnings from Alphabet, Amazon, Meta, and Microsoft, which will report after the close today, where the sole focus remains on capex. Yesterday’s report of a revenue miss at OpenAI sent NVIDIA, Oracle, and Broadcom lower. Robinhood, one of the favorite retail trading brokers, saw its shares plunge after reporting disappointing earnings, while Starbucks surged in after-hours trading.
General Motors Fundamental Analysis
General Motors is the largest auto manufacturer in the US. It manufactures Chevrolet, Buick, GMC, and Cadillac, and owns GM Defense, which caters to the military, OnStar, ACDelco, GM Financial, and has an interest in Chinese brands Baojun and Wuling.
So, why am I bearish on GM despite its earnings beat?
While General Motors beat revenue and earnings-per-share expectations of $43.51 billion and $2.60 by reporting $43.62 billion and $3.70, respectively, I remain bearish amid persistent tariff and cost pressures. Despite announcing a $500 million tariff refund, GM faces gross tariff costs of between $2.5 and $ 3.5 billion for 2026. I am also bearish on its strategic pivot away from EVs and international profitability concerns.
Metric | Value | Verdict |
P/E Ratio | 28.81 | Bearish |
P/B Ratio | 1.15 | Bullish |
PEG Ratio | 3.55 | Bearish |
Current Ratio | 1.16 | Bearish |
ROIC-WACC Ratio | Negative | Bearish |
General Motors Fundamental Analysis Snapshot
The price-to-earnings (P/E) ratio of 28.81 makes GM an expensive stock. By comparison, the P/E ratio for the S&P 500 Index is 25.79.
The average analyst price target for GM is $93.96. This suggests good upside potential, but downside risks are accelerating.
General Motors Technical Analysis
Today’s GM Signal
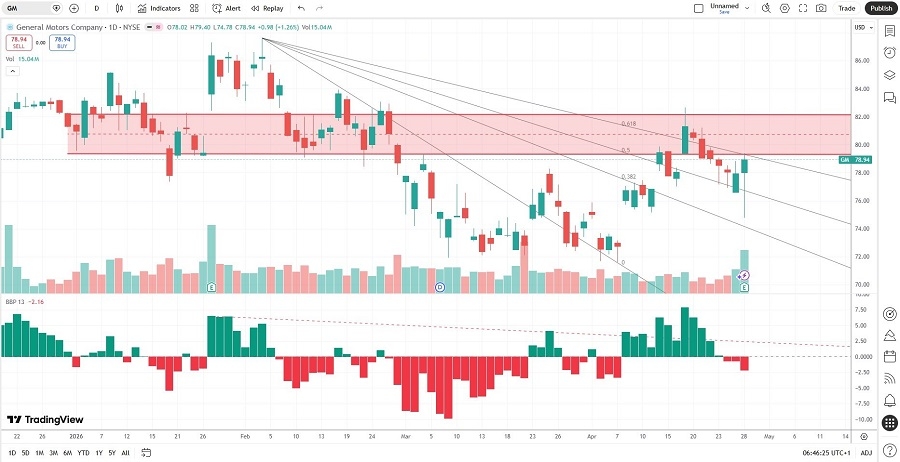
General Motors Price Chart
The GM D1 chart shows price action being rejected by its horizontal resistance zone.
It also shows price action between its descending 50.0% and 61.8% Fibonacci Retracement Fan levels.
The Bull Bear Power Indicator is bearish with a descending trendline.
The average bullish trading volumes are higher than the average bearish trading volumes, suggesting more short-term volatility potential.
GM corrected more than the S&P 500 Index, a bearish confirmation.
My GM Short Stock Trade
GM Entry Level: Between $77.76 and $79.33
GM Take Profit: Between $60.00 and $62.36
GM Stop Loss: Between $84.70 and $87.62
Risk/Reward Ratio: 2.56
Ready to trade our analysis of General Motors? Here is our list of the best stockbrokers worth checking out.