
Short Trade Idea
Enter your short position between $232.84 (Thursday’s intra-day low) and $241.97 (Thursday’s intra-day high).
Market Index Analysis
Garmin (NYSE:GRMN) is a member of the S&P 500 Index.
This index corrects within a bearish price channel with fading depressed bullish factors.
The Bull Bear Power Indicator for the S&P 500 Index turned bearish with a descending trendline.
Market Sentiment Analysis
Equity futures are moving lower as oil futures spike after US President Trump renewed his vow to destroy Iran unless they open the Strait of Hormuz by Tuesday. Markets await Thursday’s CPI and Friday’s PCE reports, which will offer clues on how the oil price surge has impacted inflationary pressures, but the true impact will take more time to work through the economy. Earnings from Delta, Levi Strauss, and Constellation Brands are also due this week, while a Trump administrator hinted at broad tariff refunds.
Garmin Fundamental Analysis
Garmin is a tech company known for its GPS, navigation, communication, and sensor-based products catering to the automotive, aviation, marine, and recreational markets. It employs nearly 23,000 employees in 34 countries.
So, why am I bearish on GRMN amid its current correction?
Higher product costs, especially in memory chips, and ongoing tariffs are likely to compress margins, putting downward pressure on earnings in the first quarter of 2026. Despite its current correction, its valuations are nearly twice the industry average. I turned bearish due to intensifying competition in wearable and fitness technology, which depresses pricing power. I am equally bearish on software integration risks following the controversial redesign of the Garmin Connect app, which has raised concerns about user retention.
Metric | Value | Verdict |
P/E Ratio | 27.70 | Bearish |
P/B Ratio | 5.10 | Bearish |
PEG Ratio | 3.08 | Bearish |
Current Ratio | 3.63 | Bullish |
ROIC-WACC Ratio | Positive | Bullish |
Garmin Fundamental Analysis Snapshot
The price-to-earnings (P/E) ratio of 27.70 makes GRMN an expensive stock. By comparison, the P/E ratio for the S&P 500 Index is 23.70.
The average analyst price target for GRMN is $260.25. It suggests moderate upside potential with elevated downside risks.
Garmin Technical Analysis
Today’s GRMN Signal
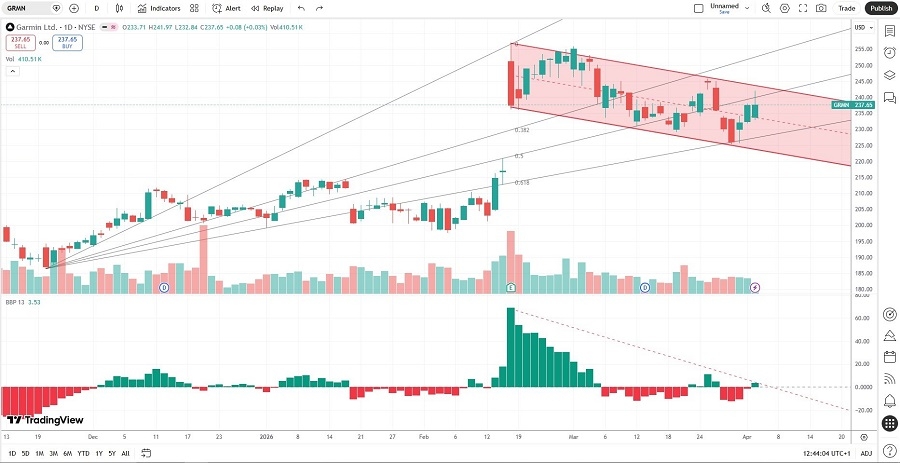
Garmin Price Chart
The GRMN D1 chart shows price action inside a bearish price channel.
It also shows price action between its ascending 50.0% and 61.8% Fibonacci Retracement Fan levels.
The Bull Bear Power Indicator turned bullish but faces its descending trendline.
The average bearish trading volumes are higher than the average bullish trading volumes.
GRMN corrected with the S&P 500 Index moved lower, a bearish confirmation.
My GRMN Short Stock Trade
GRMN Entry Level: Between $232.84 and $241.97
GRMN Take Profit: Between $186.67 and $191.44
GRMN Stop Loss: Between $253.11 and $260.25
Risk/Reward Ratio: 2.28
Ready to trade our analysis of Garmin? Here is our list of the best stock brokers worth checking out.