
Long Trade Idea
Enter your long position between $104.42 (the upper band of its horizontal support zone) and $108.20 (yesterday’s intra-day high).
Market Index Analysis
Dollar Tree (NASDAQ:DLTR) is a member of the S&P 500 Index.
This index is retreating from all-time highs, but remains at elevated levels, disconnected from economic reality.
The Bull Bear Power Indicator for the S&P 500 Index is in extremely bullish territory with a descending trendline.
Market Sentiment Analysis
The fragile ceasefire between the US and Iran is set to end this week. In corporate news, Apple CEO Tim Cook will step down on September 1st, and Tom Ternus will take over. The confirmation hearing for Kevin Warsh as the next Federal Reserve chair is ongoing, while earnings releases from United Airlines, Intel, and Tesla will highlight the week.
Dollar Tree Fundamental Analysis
Dollar Tree is a discount store with over 15,000 stores and 24 distribution centers across the continental 48 US states, as well as over 200 stores in Canada. It competes in the low-end retail segment.
So, why am I bullish on DLTR after its breakout?
I turned bullish on Dollar Tree following its 31%+ correction amid the implementation of its multi-price strategy, which priced more items between $3 and $5 and moved away from its $1.25 model. Millennials and Gen Z shoppers drive same-store sales growth, as evidenced by 20 consecutive years of expansion in this category and by over 60% of this demographic now shopping at DLTR. I am also bullish on its store optimization approach.
Metric | Value | Verdict |
P/E Ratio | 18.06 | Bullish |
P/B Ratio | 5.64 | Bearish |
PEG Ratio | 1.12 | Bullish |
Current Ratio | 1.07 | Bearish |
ROIC-WACC Ratio | Positive | Bullish |
Dollar Tree Fundamental Analysis Snapshot
The price-to-earnings (P/E) ratio of 18.06 makes DLTR an inexpensive stock. By comparison, the P/E ratio for the S&P 500 Index is 25.61.
The average analyst price target for DLTR is $125.26. This suggests moderate upside potential with acceptable downside risks.
Dollar Tree Technical Analysis
Today’s DLTR Signal
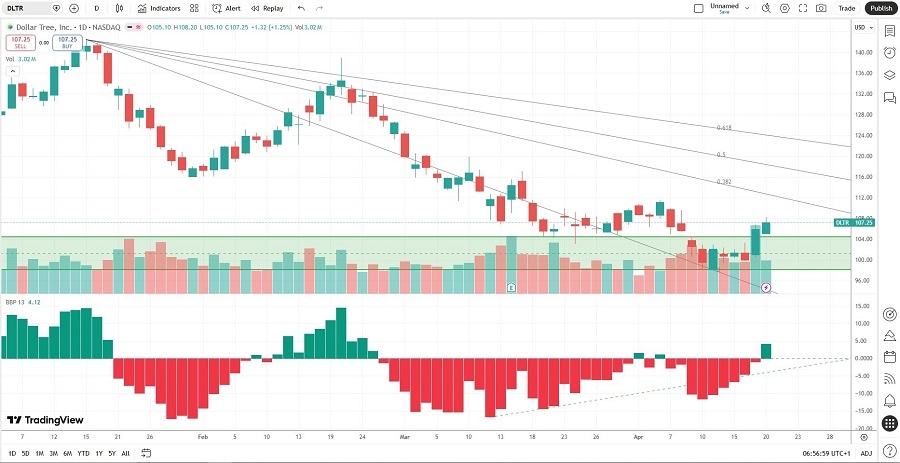
Dollar Tree Price Chart
The DLTR D1 chart shows price action breaking out above its horizontal support zone.
It also shows price action between its descending 0.0% and 38.2% Fibonacci Retracement Fan levels.
The Bull Bear Power Indicator turned bullish with an ascending trendline.
The average bullish trading volumes are higher than the average bearish trading volumes.
DLTR follows the S&P 500 Index higher, a bullish confirmation.
My DLTR Long Stock Trade
DLTR Entry Level: Between $104.42 and $108.20
DLTR Take Profit: Between $138.91 and $142.40
DLTR Stop Loss: Between $88.08 and $91.03
Risk/Reward Ratio: 2.11