
Short Trade Idea
Enter your short position between $27.77 (yesterday’s intra-day low) and $28.99 (yesterday’s intra-day high).
Market Index Analysis
Carnival (NYSE:CCL) is a member of the S&P 500 Index.
This index spiked higher yesterday, but low bullish trading volumes suggest caution ahead, as they do not confirm the recent six-day rally.
The Bull Bear Power Indicator for the S&P 500 Index turned bullish and spiked above its descending trendline.
Market Sentiment Analysis
Equity futures are drifting lower after Iran and the USA continue to argue about what are the binding points of the agreed ceasefire. The Strait of Hormuz remains functionally closed, which was one of the most core US demands. Oil prices are approaching $100 per barrel again, and markets await US PCE Price Index data, the Federal Reserve’s preferred inflation gauge.
Carnival Fundamental Analysis
Carnival is a cruise ship operator with over 90 vessels in its fleet and nine cruise line brands. It is one of the most recognized cruise line operators, known for organizing theme-based cruises.
So, why am I bearish on CCL despite its recent price spike?
While oil prices plunged following the fragile two-week cease-fire between the US and Iran, fuel costs remain well above their pre-war levels and are likely to remain elevated, applying intense margin pressure on Carnival. It has already cut its full-year 2026 earnings-per-share guidance because it does not hedge fuel costs. I am equally bearish on ongoing mechanical issues that cause operational delays, while cancellations amid strategic adjustments add to the uncertainty.
Metric | Value | Verdict |
P/E Ratio | 12.35 | Bullish |
P/B Ratio | 2.73 | Bearish |
PEG Ratio | Unavailable | Bearish |
Current Ratio | 0.30 | Bearish |
ROIC-WACC Ratio | Negative | Bearish |
Carnival Fundamental Analysis Snapshot
The price-to-earning (P/E) ratio of 12.35 makes CCL an inexpensive stock. By comparison, the P/E ratio for the S&P 500 Index is 24.33.
The average analyst price target for CCL is $34.95. This suggests moderate upside potential with rising downside risks.
Carnival Technical Analysis
Today’s CCL Signal
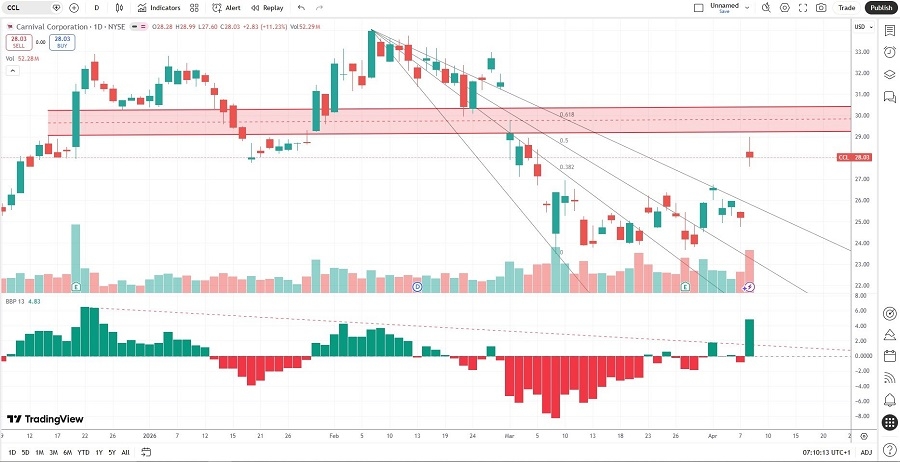
Carnival Price Chart
The CCL D1 chart shows price action below its horizontal resistance zone.
It also shows price action breaking out above its descending Fibonacci Retracement Fan.
The Bull Bear Power Indicator turned bullish and spiked above its descending trendline.
The average bearish trading volumes are higher than the average bullish trading volumes.
CCL spiked higher with the S&P 500 Index, a bullish confirmation, but bearish catalysts are rising.
My CCL Short Stock Trade
CCL Entry Level: Between $27.77 and $28.99
CCL Take Profit: Between $15.07 and $16.34
CCL Stop Loss: Between $32.99 and $34.03
Risk/Reward Ratio: 2.43
Ready to trade our analysis of Carnival? Here is our list of the best stock brokers worth checking out.