
Short Trade Idea
Enter your short position between $39.65 (the intra-day low of its last bearish candlestick) and $41.87 (the intra-day high of its last bearish candlestick).
Market Index Analysis
- CarMax (NYSE:KMX) is a member of the S&P 500 Index.
- This index is retreating from all-time highs, but remains at elevated levels, disconnected from economic reality.
- The Bull Bear Power Indicator for the S&P 500 Index is in extremely bullish territory with a descending trendline.
Market Sentiment Analysis
The fragile ceasefire between the US and Iran is set to end this week. In corporate news, Apple CEO Tim Cook will step down on September 1st, and Tom Ternus will take over. The confirmation hearing for Kevin Warsh as the next Federal Reserve chair is ongoing, while earnings releases from United Airlines, Intel, and Tesla will highlight the week.
CarMax Fundamental Analysis
CarMax is the largest used vehicle retailer in the US. It operates two business units: CarMax Sales Operations and CarMax Auto Finance. Its multichannel platform supports both online and in-store purchases, with options for home delivery and contactless curbside pickup.
So, why am I bullish on KMX following its post-earnings sell-off?
While CarMax beat revenue and earnings-per-share expectations of $5.72 billion and $0.23, respectively, reporting $5.95 billion and $0.34, shares plunged over 15% as profit-per-vehicle is expected to decline moving forward. Margins are decreasing amid price cuts and cost controls, which may deliver long-term structural balance-sheet improvements but could yield more medium-term downside pressure. Its $140+ million goodwill impairment charge, weak operating cash flows, and rising digital competition add to headwinds.
Metric | Value | Verdict |
P/E Ratio | 24.20 | Bullish |
P/B Ratio | 0.98 | Bullish |
PEG Ratio | 0.70 | Bullish |
Current Ratio | 2.20 | Bullish |
ROIC-WACC Ratio | Negative | Bearish |
CarMax Fundamental Analysis Snapshot
The price-to-earnings (P/E) ratio of 24.20 makes KMX an inexpensive stock. By comparison, the P/E ratio for the S&P 500 Index is 25.61.
The average analyst price target for KMX is $41.69. This suggests no upside potential with rising downside risks.
CarMax Technical Analysis
Today’s KMX Signal
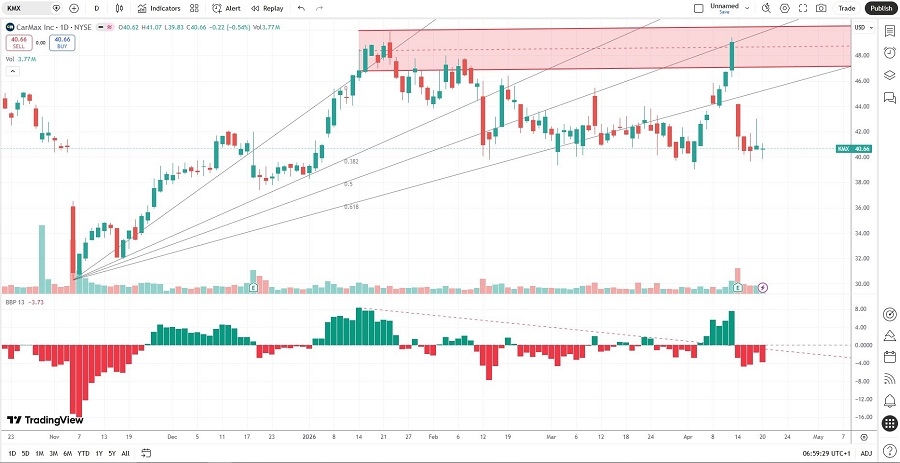
CarMax Price Chart
- The KMX D1 chart shows price action breaking down below its horizontal resistance zone.
- It also shows price action breaking down below its ascending Fibonacci Retracement Fan.
- The Bull Bear Power Indicator is bearish with a descending trendline.
- The average bearish trading volumes are higher than the average bullish trading volumes.
- KMX plunged as the S&P 500 Index pushed to all-time highs, a bearish confirmation.
My KMX Short Stock Trade h2
- KMX Entry Level: Between $39.65 and $41.87
- KMX Take Profit: Between $30.26 and $31.95
- KMX Stop Loss: Between $44.20 and $45.83
- Risk/Reward Ratio: 2.06
Ready to trade our analysis of CarMax? Here is our list of the best stockbrokers worth checking out.